The MI Procedure
- Overview
- Getting Started
-
Syntax

-
DetailsDescriptive StatisticsEM Algorithm for Data with Missing ValuesStatistical Assumptions for Multiple ImputationMissing Data PatternsImputation MethodsMonotone Methods for Data Sets with Monotone Missing PatternsMonotone and FCS Regression MethodsMonotone and FCS Predictive Mean Matching MethodsMonotone and FCS Discriminant Function MethodsMonotone and FCS Logistic Regression MethodsMonotone Propensity Score MethodFCS Methods for Data Sets with Arbitrary Missing PatternsChecking Convergence in FCS MethodsMCMC Method for Arbitrary Missing Multivariate Normal DataProducing Monotone Missingness with the MCMC MethodMCMC Method SpecificationsChecking Convergence in MCMCInput Data SetsOutput Data SetsCombining Inferences from Multiply Imputed Data SetsMultiple Imputation EfficiencyImputer’s Model Versus Analyst’s ModelParameter Simulation versus Multiple ImputationSensitivity Analysis for the MAR AssumptionMultiple Imputation with Pattern-Mixture ModelsSpecifying Sets of Observations for Imputation in Pattern-Mixture ModelsAdjusting Imputed Values in Pattern-Mixture ModelsSummary of Issues in Multiple ImputationODS Table NamesODS Graphics
-
ExamplesEM Algorithm for MLEMonotone Propensity Score MethodMonotone Regression MethodMonotone Logistic Regression Method for CLASS VariablesMonotone Discriminant Function Method for CLASS VariablesFCS Method for Continuous VariablesFCS Method for CLASS VariablesFCS Method with Trace PlotMCMC MethodProducing Monotone Missingness with MCMCChecking Convergence in MCMCSaving and Using Parameters for MCMCTransforming to NormalityMultistage ImputationCreating Control-Based Pattern Imputation in Sensitivity AnalysisAdjusting Imputed Continuous Values in Sensitivity AnalysisAdjusting Imputed Classification Levels in Sensitivity AnalysisAdjusting Imputed Values with Parameters in a Data Set
- References
This example uses FCS methods to impute missing values in both continuous and classification variables in a data set with
an arbitrary missing pattern. The following statements use a logistic regression method to impute values of the classification
variable Species:
ods graphics on;
proc mi data=Fish3 seed=1305417 out=outex8;
   class Species;
   fcs plots=trace
       logistic(Species= Length Width Length*Width /details link=glogit);
   var Species Length Width;
run;
ods graphics off;
The “Model Information” table in Output 61.8.1 describes the method and options used in the multiple imputation process. By default, a regression method is used to impute missing values in each continuous variable.
Output 61.8.1: Model Information
| Model Information | |
|---|---|
| Data Set | WORK.FISH3 |
| Method | FCS |
| Number of Imputations | 5 |
| Number of Burn-in Iterations | 20 |
| Seed for random number generator | 1305417 |
The “FCS Model Specification” table in Output 61.8.2 describes methods and imputed variables in the imputation model. The procedure uses the logistic regression method to impute
the variable Species, and the regression method to impute variables Height and Width.
Output 61.8.2: FCS Model Specification
| FCS Model Specification | |
|---|---|
| Method | Imputed Variables |
| Regression | Length Width |
| Logistic Regression | Species |
The “Missing Data Patterns” table in Output 61.8.3 lists distinct missing data patterns with corresponding frequencies and percentages.
Output 61.8.3: Missing Data Patterns
| Missing Data Patterns | |||||||
|---|---|---|---|---|---|---|---|
| Group | Species | Length | Width | Freq | Percent | Group Means | |
| Length | Width | ||||||
| 1 | X | X | X | 67 | 77.01 | 27.910448 | 4.361860 |
| 2 | X | X | . | 5 | 5.75 | 24.620000 | . |
| 3 | X | . | X | 6 | 6.90 | . | 4.167667 |
| 4 | . | X | X | 6 | 6.90 | 26.683333 | 4.136233 |
| 5 | . | X | . | 2 | 2.30 | 31.500000 | . |
| 6 | . | . | X | 1 | 1.15 | . | 3.663600 |
When you use the DETAILS keyword in the LOGISTIC option, parameters estimated from the observed data and the parameters used in each imputation are displayed in the “Logistic Models for FCS Method” table in Output 61.8.4.
Output 61.8.4: FCS Logistic Regression Model for Species
| Logistic Models for FCS Method | |||||||
|---|---|---|---|---|---|---|---|
| Imputed Variable |
Effect | Species | Imputation | ||||
| 1 | 2 | 3 | 4 | 5 | |||
| Species | Intercept | Parkki | -2.172588 | -2.324226 | -2.418362 | -1.832884 | -0.929242 |
| Species | Intercept | Perch | 1.878263 | 0.445966 | 1.585375 | 0.919562 | 1.547549 |
| Species | Length | Parkki | 6.107448 | 6.377145 | 2.447654 | -1.004869 | 2.363073 |
| Species | Length | Perch | -5.493897 | -4.711566 | -7.778194 | -5.400749 | -0.053788 |
| Species | Width | Parkki | -8.624156 | -6.965179 | -5.718729 | -0.997851 | -2.978868 |
| Species | Width | Perch | 8.111323 | 5.608314 | 9.426901 | 5.502755 | 1.241239 |
| Species | Length*Width | Parkki | -0.006404 | 2.138551 | 0.883903 | 0.072525 | -0.152662 |
| Species | Length*Width | Perch | 1.151183 | 1.278025 | 1.117492 | -0.195462 | 0.672738 |
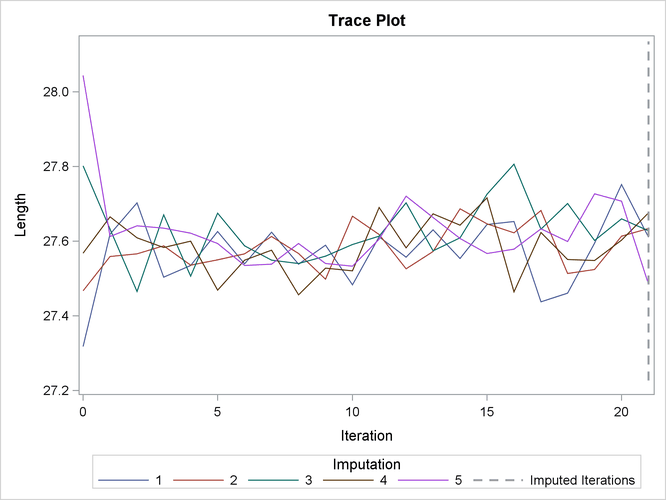
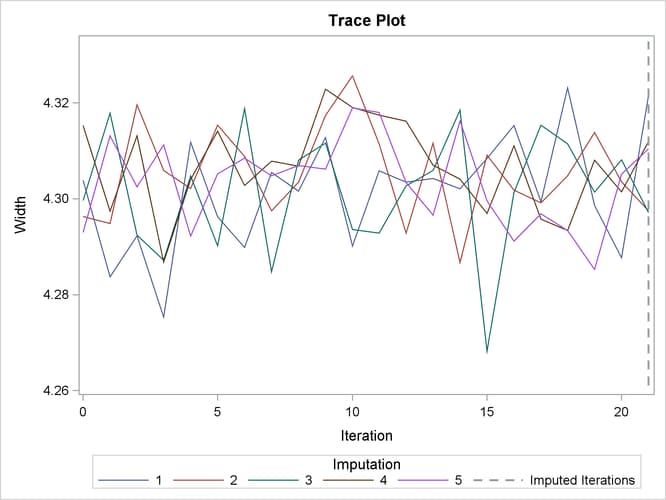
With ODS Graphics enabled, the PLOTS=TRACE option displays trace plots of means for all continuous variables by default, as shown in Output 61.8.5 and Output 61.8.6. The dashed vertical lines indicate the imputed iterations—that is, the variable values used in the imputations. The plot shows no apparent trends for the two variables.
The following statements list the first 10 observations of the data set Outex8 in Output 61.8.7:
proc print data=outex8(obs=10);
   title 'First 10 Observations of the Imputed Data Set';
run;
Output 61.8.7: Imputed Data Set
| First 10 Observations of the Imputed Data Set |
| Obs | _Imputation_ | Species | Length | Width |
|---|---|---|---|---|
| 1 | 1 | Roach | 16.2000 | 2.26800 |
| 2 | 1 | Roach | 20.3000 | 2.82170 |
| 3 | 1 | Roach | 21.2000 | 3.40493 |
| 4 | 1 | Roach | 22.4203 | 3.17460 |
| 5 | 1 | Roach | 22.2000 | 3.57420 |
| 6 | 1 | Roach | 22.8000 | 3.35160 |
| 7 | 1 | Roach | 23.1000 | 3.39570 |
| 8 | 1 | Roach | 23.7000 | 3.73166 |
| 9 | 1 | Roach | 24.7000 | 3.75440 |
| 10 | 1 | Roach | 24.3000 | 3.54780 |
After the completion of five imputations by default, the “Variance Information” table in Output 61.8.8 displays the between-imputation variance, within-imputation variance, and total variance for combining complete-data inferences for continuous variables. The relative increase in variance due to missingness, the fraction of missing information, and the relative efficiency for each variable are also displayed. These statistics are described in the section Combining Inferences from Multiply Imputed Data Sets.
Output 61.8.8: Variance Information
| Variance Information | |||||||
|---|---|---|---|---|---|---|---|
| Variable | Variance | DF | Relative Increase in Variance |
Fraction Missing Information |
Relative Efficiency |
||
| Between | Within | Total | |||||
| Length | 0.005177 | 0.815388 | 0.821601 | 83.332 | 0.007620 | 0.007590 | 0.998484 |
| Width | 0.000108 | 0.028944 | 0.029074 | 83.656 | 0.004496 | 0.004486 | 0.999104 |
The “Parameter Estimates” table in Output 61.8.9 displays a 95% mean confidence interval and a t statistic with its associated p-value for each of the hypotheses requested with the default MU0=0 option.
Output 61.8.9: Parameter Estimates
| Parameter Estimates | ||||||||||
|---|---|---|---|---|---|---|---|---|---|---|
| Variable | Mean | Std Error | 95% Confidence Limits | DF | Minimum | Maximum | Mu0 | t for H0: Mean=Mu0 |
Pr > |t| | |
| Length | 27.606967 | 0.906422 | 25.80424 | 29.40970 | 83.332 | 27.485512 | 27.675952 | 0 | 30.46 | <.0001 |
| Width | 4.307702 | 0.170510 | 3.96860 | 4.64680 | 83.656 | 4.297146 | 4.321571 | 0 | 25.26 | <.0001 |