The PROBIT Procedure
- Overview
-
Getting Started

-
SyntaxPROC PROBIT StatementBY StatementCDFPLOT StatementCLASS StatementEFFECTPLOT StatementESTIMATE StatementINSET StatementIPPPLOT StatementLPREDPLOT StatementLSMEANS StatementLSMESTIMATE StatementMODEL StatementOUTPUT StatementPREDPPLOT StatementSLICE StatementSTORE StatementTEST StatementWEIGHT Statement
-
DetailsMissing ValuesResponse Level OrderingComputational MethodDistributionsINEST= SAS-data-setModel SpecificationLack-of-Fit TestsRescaling the Covariance MatrixTolerance DistributionInverse Confidence LimitsOUTEST= SAS-data-setXDATA= SAS-data-setTraditional High-Resolution GraphicsDisplayed OutputODS Table NamesODS Graphics
-
Examples
- References
Recall the previous example of an epidemic study, in which the treat*sex interaction is statistically significant. Suppose you want to know whether such an effect is the same at different levels
of the two categorical variables.
The following SAS statements fit a probit model and use the SLICE statement to request analysis of the two-way interaction
term treat*sex:
proc probit data=epidemic;
   class treat sex;
   model r/n = dose treat sex treat*sex;
   slice treat*sex / diff;
   effectplot;
run;
Output 75.5.1 displays the test results for the interaction effect. As you can see, the difference between the two treatments is not significant among females.
Output 75.5.1: Tests Conditional on treat*sex
| Chi-Square Test for treat*sex Least Squares Means Slice |
|||
|---|---|---|---|
| Slice | Num DF | Chi-Square | Pr > ChiSq |
| treat A | 1 | 18.52 | <.0001 |
| Chi-Square Test for treat*sex Least Squares Means Slice |
|||
|---|---|---|---|
| Slice | Num DF | Chi-Square | Pr > ChiSq |
| treat B | 1 | 2.65 | 0.1035 |
| Chi-Square Test for treat*sex Least Squares Means Slice |
|||
|---|---|---|---|
| Slice | Num DF | Chi-Square | Pr > ChiSq |
| sex 0 | 1 | 0.00 | 0.9579 |
| Chi-Square Test for treat*sex Least Squares Means Slice |
|||
|---|---|---|---|
| Slice | Num DF | Chi-Square | Pr > ChiSq |
| sex 1 | 1 | 47.43 | <.0001 |
The DIFF option computes effect differences between groups within the same slice. Results are displayed in Output 75.5.2.
Output 75.5.2: Effect Differences Conditional on treat*sex
| Simple Differences of treat*sex Least Squares Means |
||||||
|---|---|---|---|---|---|---|
| Slice | sex | _sex | Estimate | Standard Error | z Value | Pr > |z| |
| treat A | 0 | 1 | 0.5957 | 0.1384 | 4.30 | <.0001 |
| Simple Differences of treat*sex Least Squares Means |
||||||
|---|---|---|---|---|---|---|
| Slice | sex | _sex | Estimate | Standard Error | z Value | Pr > |z| |
| treat B | 0 | 1 | -0.2956 | 0.1816 | -1.63 | 0.1035 |
| Simple Differences of treat*sex Least Squares Means |
||||||
|---|---|---|---|---|---|---|
| Slice | treat | _treat | Estimate | Standard Error | z Value | Pr > |z| |
| sex 0 | A | B | -0.00899 | 0.1702 | -0.05 | 0.9579 |
| Simple Differences of treat*sex Least Squares Means |
||||||
|---|---|---|---|---|---|---|
| Slice | treat | _treat | Estimate | Standard Error | z Value | Pr > |z| |
| sex 1 | A | B | -0.9003 | 0.1307 | -6.89 | <.0001 |
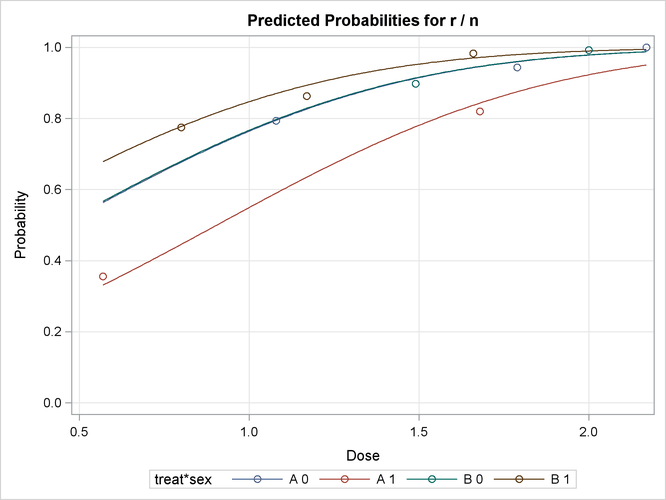
The EFFECTPLOT statement produces a predicted probability plot for dose by the four groups that are formed by the treat*sex interaction. The plot is displayed in Output 75.5.3. The two overlapping curves represent the two treatment groups for females, suggesting no treatment effect. It appears that
males tend to respond to the two treatments differently: those on treatment B have a better survival rate, and those on treatment
A have a worse chance of survival.