The POWER Procedure
- Overview
-
Getting Started

-
Syntax
-
Details
-
ExamplesOne-Way ANOVAThe Sawtooth Power Function in Proportion AnalysesSimple AB/BA Crossover DesignsNoninferiority Test with Lognormal DataMultiple Regression and CorrelationComparing Two Survival CurvesConfidence Interval PrecisionCustomizing PlotsBinary Logistic Regression with Independent PredictorsWilcoxon-Mann-Whitney Test
- References
An investment firm has hired you to help plan a study to estimate the success of a new investment strategy called “IntuiVest.” The study involves complex simulations of market conditions over time, and it tracks the balance of a hypothetical brokerage account starting with $50,000. Each simulation is very expensive in terms of computing time. You are asked to determine an appropriate number of simulations to estimate the average change in the account balance at the end of three years. The goal is to have a 95% chance of obtaining a 90% confidence interval whose half-width is at most $1,000. That is, the firm wants to have a 95% chance of being able to correctly claim at the end of the study that “Our research shows with 90% confidence that IntuiVest yields a profit of $X +/– $1,000 at the end of three years on an initial investment of $50,000 (under simulated market conditions).”
The probability of achieving the desired precision (that is, a small interval width) can be calculated either unconditionally or conditionally given that the true mean is captured by the interval. You decide to use the conditional form, considering two of its advantages:
-
The conditional probability is usually lower than the unconditional probability for the same sample size, meaning that the conditional form is generally conservative.
-
The overall probability of achieving the desired precision and capturing the true mean is easily computed as the product of the half-width probability and the confidence level. In this case, the overall probability is
 .
.
Based on some initial simulations, you expect a standard deviation between $25,000 and $45,000 for the ending account balance. You will consider both of these values in the sample size analysis.
As mentioned in the section Overview of Power Concepts, an analysis of confidence interval precision is analogous to a traditional power analysis, with “CI Half-Width” taking the place of effect size and “Prob(Width)” taking the place of power. In this example, the target CI Half-Width is 1000, and the desired Prob(Width) is 0.95.
In addition to computing sample sizes for a half-width of $1,000, you are asked to plot the required number of simulations for a range of half-widths between $500 and $2,000. Use the ONESAMPLEMEANS statement with the CI=T option to implement the sample size determination. The following statements perform the analysis:
ods listing style=htmlbluecml;
ods graphics on;

proc power;
   onesamplemeans ci=t
      alpha = 0.1
      halfwidth = 1000
      stddev = 25000 45000
      probwidth = 0.95
      ntotal = .;
   plot x=effect min=500 max=2000;
run;

ods graphics off;
The ODS LISTING STYLE=HTMLBLUECML statement specifies the HTMLBLUECML style, which is suitable for use with PROC POWER because it allows both marker symbols and line styles to vary. See the section ODS Styles Suitable for Use with PROC POWER for more information.
The NTOTAL=. option identifies sample size as the parameter to compute. The ALPHA=0.1 option specifies a confidence level of ![]() = 0.9. The HALFWIDTH= option specifies the target half-width, and the STDDEV= option specifies the conjectured standard deviation values. The PROBWIDTH= option specifies the desired probability of achieving the target precision. The default value PROBTYPE=CONDITIONAL specifies that this probability is conditional on the true mean being captured by the interval. The default of
SIDES=2 indicates a two-sided interval.
= 0.9. The HALFWIDTH= option specifies the target half-width, and the STDDEV= option specifies the conjectured standard deviation values. The PROBWIDTH= option specifies the desired probability of achieving the target precision. The default value PROBTYPE=CONDITIONAL specifies that this probability is conditional on the true mean being captured by the interval. The default of
SIDES=2 indicates a two-sided interval.
Output 71.7.1 shows the output, and Output 71.7.2 shows the plot.
Output 71.7.1: Sample Size Determination for Confidence Interval Precision
| Fixed Scenario Elements | |
|---|---|
| Distribution | Normal |
| Method | Exact |
| Alpha | 0.1 |
| CI Half-Width | 1000 |
| Nominal Prob(Width) | 0.95 |
| Number of Sides | 2 |
| Prob Type | Conditional |
| Computed N Total | |||
|---|---|---|---|
| Index | Std Dev | Actual Prob(Width) | N Total |
| 1 | 25000 | 0.951 | 1788 |
| 2 | 45000 | 0.950 | 5652 |
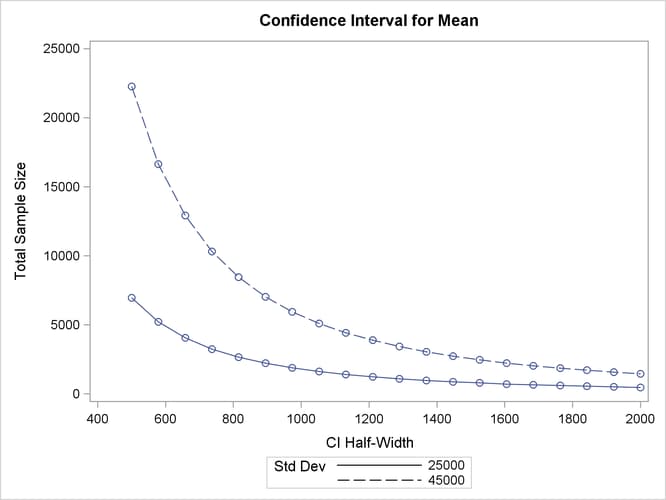
The number of simulations required in order to have a 95% chance of obtaining a half-width of at most 1000 is between 1788 and 5652, depending on the standard deviation. The plot reveals that more than 20,000 simulations would be required for a half-width of 500, assuming the higher standard deviation.