Modifying the Layout and Adding a New Inset Table
You can use the following statements to make the plot shown in Output 22.3.5 with the default at-risk table:
proc lifetest data=sashelp.BMT plots=survival(atrisk=0 to 2500 by 500);
   ods select SurvivalPlot;
   time T * Status(0);
   strata Group;
run;
Output 22.3.5: Survival Plot with Number of Subjects At Risk
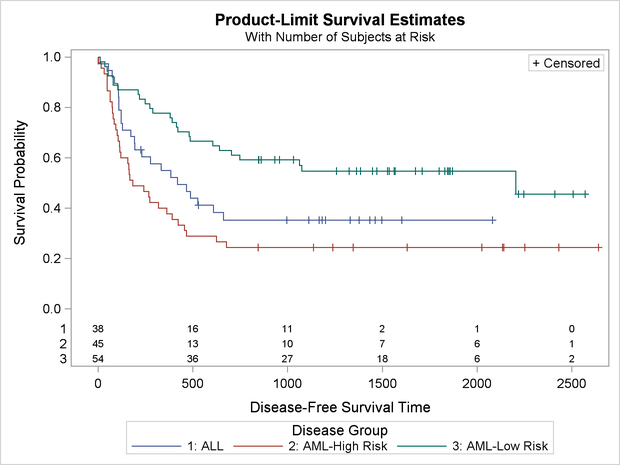
Output 22.3.5 displays the estimated disease-free survival functions for the three leukemia groups with the number of subjects at risk at 0, 500, 1,000, 1,500, 2,000, and 2,500 days.
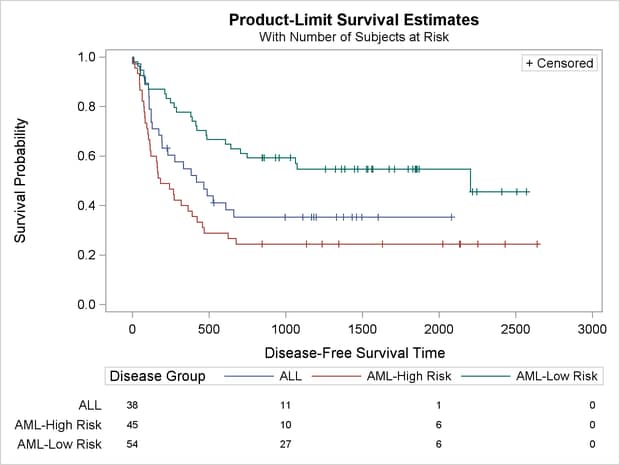
You can display this table outside the graph, display the table in 15% of the available space, and display row labels up to 13 characters long as follows:
proc lifetest data=sashelp.BMT
   plots=survival(atrisk(maxlen=13 outside(0.15)));
   ods select SurvivalPlot;
   time T * Status(0);
   strata Group;
run;
Output 22.3.6: Survival Plot with an External At-Risk Table
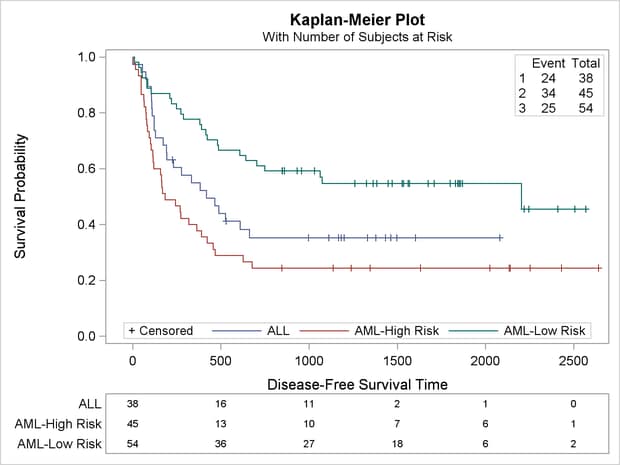
The rest of this example shows you how to modify the template to produce the plot displayed in Output 22.3.7. This new plot differs from the old plot in several ways. It has a new inset table in the top right corner with the number of observations and the number of events in the each stratum. The legend has been moved inside the plot and combined with the old inset table that showed the marker for censored observations. The information about the subjects at risk has been moved into a table below the plot. Also, the title change from the first part of the example is retained. These changes are easy, if they are broken down and performed one step at a time.
Output 22.3.7: Kaplan-Meier Plot with a Different Layout
You can begin this step by submitting the original macro definitions from the section Creating a Template That Is Easy to Modify:
%SurvivalTemplateRestore
Notice that the survival plot template has two major parts: a layout that is used when there is only one stratum and a layout
that is used with more than one stratum. You can see the two major parts in the definition of the %SurvivalTemplate macro. Every section of this example has more than one stratum, so it is the changes to the second layout and the %MultipleStrata macro (or more precisely the ELSE portion of the template) that are affecting the results.
PROC LIFETEST makes available a series of dynamic variables that it does not display by default. See the section Additional Dynamic Variables for Survival Plots Using ODS Graphics in Chapter 52: The LIFETEST Procedure, for information about these dynamic variables. You can use these dynamic variables to add the new inset table to the plot. The following statements show how to add a gridded layout to the graph:
dynamic NObs1 NObs2 NObs3 NEvent1 NEvent2 NEvent3;
layout gridded / columns=3 border=TRUE autoalign=(TopRight);
   entry "";      entry "Event";   entry "Total";
   entry "1";     entry NEvent1;   entry NObs1;
   entry "2";     entry NEvent2;   entry NObs2;
   entry "3";     entry NEvent3;   entry Nobs3;
endlayout;
These statements are added to the end of the %MultipleStrata macro.
The at-risk information in Output 22.3.5 is produced by the following BLOCKPLOT statement, which is displayed in the context of the IF and INNERMARGIN statements that go with it:
if (PLOTATRISK=1)
   innermargin / align=bottom;
      blockplot x=TATRISK block=ATRISK / class=CLASSATRISK
         display=(label values) &blockopts;
   endinnermargin;
endif;
In the next step, the at-risk block plot is moved out of the plot and into a table below the plot. The template has a new overall layout—a LAYOUT LATTICE that has two panels stacked vertically, one for the plot and one for the at-risk information. Using ROWWEIGHTS=(.85 .15), the plot on top occupies 85% of the display and the at-risk information in the second panel occupies 15%. The option COLUMNDATARANGE=UNIONALL creates a common axis across the two panels. In these next steps, you also move the legend inside (similar to a previous part of this example) and rearrange the three inset boxes.
The new template structure is as follows:
%let TitleText2 = "Kaplan-Meier Plot";

%macro SurvivalTemplate;
   proc template;
      define statgraph Stat.Lifetest.Graphics.ProductLimitSurvival;
         dynamic NStrata xName plotAtRisk plotCL plotHW plotEP labelCL
            %if %nrbquote(&censored) ne %then plotCensored;
            labelHW labelEP maxTime xtickVals xtickValFitPol method StratumID
            classAtRisk plotBand plotTest GroupName yMin Transparency
            SecondTitle TestName pValue;
         BeginGraph;

            entrytitle &titletext2;
            if (EXISTS(SECONDTITLE))
               entrytitle SECONDTITLE / textattrs=GRAPHVALUETEXT;
            endif;

            layout lattice /  rows=2 columns=1 columndatarange=unionall
                              rowweights=(.85 .15);
               layout overlay / xaxisopts=(&xoptions) yaxisopts=(&yoptions);
                  %multiplestrata
               endlayout;

               layout overlay / xaxisopts=(display=none);
                  blockplot x=TATRISK block=ATRISK / class=CLASSATRISK
                  display=(label values) &blockopts;
               endlayout;
            endlayout;

         EndGraph;
      end;
   run;
%mend;

%macro multiplestrata;
  if (PLOTHW)
      bandplot LimitUpper=HW_UCL LimitLower=HW_LCL x=TIME / &bandopts
               datatransparency=Transparency;
   endif;
   if (PLOTEP)
      bandplot LimitUpper=EP_UCL LimitLower=EP_LCL x=TIME / &bandopts
               datatransparency=Transparency;
   endif;
   if (PLOTCL)
      if (PLOTBAND)
         bandplot LimitUpper=SDF_UCL LimitLower=SDF_LCL x=TIME / &bandopts
                  display=(outline);
      else
         bandplot LimitUpper=SDF_UCL LimitLower=SDF_LCL x=TIME / &bandopts
                  datatransparency=Transparency;
      endif;
   endif;
   stepplot y=SURVIVAL x=TIME / &groups name="Survival" &tips;

   if (PLOTCENSORED)
      scatterplot y=CENSORED x=TIME / &groups &censored &tipl;
   endif;

   DiscreteLegend "Survival" / title=GROUPNAME location=outside;

   if (PLOTCENSORED)
      if (PLOTTEST)
         layout gridded / rows=2 &gridopts;
            entry &censorstr;
            %entry_p
         endlayout;
      else
         layout gridded / rows=1 &gridopts;
            entry &censorstr;
         endlayout;
      endif;
   else
      if (PLOTTEST)
         layout gridded / rows=1 &gridopts;
            %entry_p
         endlayout;
      endif;
   endif;

   dynamic NObs1 NObs2 NObs3 NEvent1 NEvent2 NEvent3;
   layout gridded / columns=3 border=TRUE autoalign=(TopRight);
      entry "";      entry "Event";   entry "Total";
      entry "1";     entry NEvent1;   entry NObs1;
      entry "2";     entry NEvent2;   entry NObs2;
      entry "3";     entry NEvent3;   entry Nobs3;
   endlayout;
%mend;

%SurvivalTemplate
You can further simplify the plot by moving the legend inside, removing the title from the legend (which is currently the
variable name Group), and instead adding “+ Censored” (the contents of the inset table) to the legend in place of the title, as in the following statement:
DiscreteLegend "Survival" / title="+ Censored"
   titleattrs=GraphValueText location=inside autoalign=(Bottom);
The option TITLEATTRS=GRAPHVALUETEXT is specified so that the “+ Censored” appears in the same font as the other entries in the legend and appears to be just another part of the legend. All of the statements for making the old inset table can now be removed from the template. The full template also plots bands, which are not used in this example, so they can also be removed. The resulting template is as follows:
%let TitleText2 = "Kaplan-Meier Plot";

%macro SurvivalTemplate;
   proc template;
      define statgraph Stat.Lifetest.Graphics.ProductLimitSurvival;
         dynamic NStrata xName plotAtRisk plotCL plotHW plotEP labelCL
            %if %nrbquote(&censored) ne %then plotCensored;
            labelHW labelEP maxTime xtickVals xtickValFitPol method StratumID
            classAtRisk plotBand plotTest GroupName yMin Transparency
            SecondTitle TestName pValue;
         BeginGraph;

            entrytitle &titletext2;
            if (EXISTS(SECONDTITLE))
               entrytitle SECONDTITLE / textattrs=GRAPHVALUETEXT;
            endif;

            layout lattice /  rows=2 columns=1 columndatarange=unionall
                              rowweights=(.85 .15);
               layout overlay / xaxisopts=(&xoptions) yaxisopts=(&yoptions);
                  %multiplestrata
               endlayout;

               layout overlay / xaxisopts=(display=none);
                  blockplot x=TATRISK block=ATRISK / class=CLASSATRISK
                  display=(label values) &blockopts;
               endlayout;
            endlayout;

         EndGraph;
      end;
   run;
%mend;
%macro MultipleStrata;

   stepplot y=SURVIVAL x=TIME / &groups name="Survival" &tips;

   if (PLOTCENSORED)
      scatterplot y=CENSORED x=TIME / &groups &censored &tipl;
   endif;

   DiscreteLegend "Survival" / title="+ Censored"
      titleattrs=GraphValueText location=inside autoalign=(Bottom);

   dynamic NObs1 NObs2 NObs3 NEvent1 NEvent2 NEvent3;
   layout gridded / columns=3 border=TRUE autoalign=(TopRight);
      entry "";      entry "Event";   entry "Total";
      entry "1";     entry NEvent1;   entry NObs1;
      entry "2";     entry NEvent2;   entry NObs2;
      entry "3";     entry NEvent3;   entry Nobs3;
   endlayout;
%mend;

%SurvivalTemplate
The following step uses the new template to create the desired plot:
proc lifetest data=sashelp.BMT
   plots=survival(maxlen=13 atrisk=0 to 2500 by 500);
   ods select SurvivalPlot;
   time T * Status(0);
   strata Group;
run;
The plot is displayed in Output 22.3.7 at the beginning of this section.
This example removed a great deal of functionality from the default template so that the final, modified template would be relatively simple and understandable, but this is not necessary. The template could have been modified without deleting the first LAYOUT OVERLAY and other statements. The strategy for template modification illustrated in this example can be applied to any complicated template: identify the overall structure, isolate the relevant pieces, and then make changes in stages. Since the modified template no longer works for all analyses, it is important that you delete it when you are done, as in the following example:
%SurvivalTemplateRestore

proc template;
   delete Stat.Lifetest.Graphics.ProductLimitSurvival / store=sasuser.templat;
run;