The SCORE Procedure

Getting Started: SCORE Procedure
The SCORE procedure multiplies the values from two SAS data sets and creates a new data set to contain the results of the multiplication. The variables in the new data set are linear combinations of the variables in the two input data sets. Typically, one of these data sets contains raw data that you want to score, and the other data set contains scoring coefficients.
The following example demonstrates how to use the SCORE procedure to multiply values from two SAS data sets, one containing factor-scoring coefficients and the other containing raw data to be scored using the scoring coefficients.
Suppose you are interested in the performance of three different types of schools: private schools, state-run urban schools, and state-run rural schools. You want to compare the schools’ performances as measured by student grades on standard tests in English, mathematics, and biology. You administer these tests and record the scores for each of the three types of schools.
The following DATA step creates the SAS data set Schools. The data are provided by Chaseling (1996).
data Schools;
   input Type $ English Math Biology @@;
   datalines;
p  52  55  45  p  42  49  40  p  63  64  54
p  47  50  51  p  64  69  47  p  63  67  54
p  59  63  42  p  56  61  41  p  41  44  72
p  39  42  45  p  56  63  44  p  63  73  42

   ... more lines ...

r  50  47  49  r  55  48  46  r  38  36  51
;
The data set Schools contains the character variable Type, which represents the type of school. Valid values are p (private schools), r (state-run rural schools), and u (state-run
urban schools).
The three numeric variables in the data set are English, Math, and Biology, which represent the student scores for English, mathematics, and biology, respectively. The double trailing at sign (@@)
in the INPUT statement specifies that observations are input from each line until all values are read.
The following statements invoke the FACTOR procedure to compute the data set of factor scoring coefficients. The statements
perform a principal components factor analysis that uses all three numeric variables in the SAS data set Schools. The OUTSTAT= option requests that PROC FACTOR output the factor scores to the data set Scores. The NOPRINT option suppresses display of the output.
proc factor data=Schools score outstat=Scores noprint;
   var english math biology;
run;

proc score data=schools score=Scores out=New;
   var english math biology;
   id type;
run;
The SCORE procedure is then invoked using Schools as the raw data set to be scored and Scores as the scoring data set. The OUT= option creates the SAS data set New to contain the linear combinations.
The VAR statement specifies that the variables English, Math, and Biology are used in computing scores. The ID statement copies the variable Type from the Schools data set to the output data set New.
The following statements print the SAS output data set Scores, the first two observations from the original data set Schools, and the first two observations of the resulting data set New.
title 'OUTSTAT= Data Set from PROC FACTOR';
proc print data=Scores;
run;
title 'First Two Observations of the DATA= Data Set from PROC SCORE';
proc print data=Schools(obs=2);
run;
title 'First Two Observations of the OUT= Data Set from PROC SCORE';
proc print data=New(obs=2);
run;
Figure 82.1 displays the output data set Scores produced by the FACTOR procedure. The last observation (number 11) contains the scoring coefficients (_TYPE_=’SCORE’). Only one factor has been retained.
Figure 82.1: Listing of the Data Set Created by PROC FACTOR
| OUTSTAT= Data Set from PROC FACTOR |
| Obs | _TYPE_ | _NAME_ | English | Math | Biology |
|---|---|---|---|---|---|
| 1 | MEAN | 55.525 | 52.325 | 50.350 | |
| 2 | STD | 12.949 | 12.356 | 12.239 | |
| 3 | N | 120.000 | 120.000 | 120.000 | |
| 4 | CORR | English | 1.000 | 0.833 | 0.672 |
| 5 | CORR | Math | 0.833 | 1.000 | 0.594 |
| 6 | CORR | Biology | 0.672 | 0.594 | 1.000 |
| 7 | COMMUNAL | 0.881 | 0.827 | 0.696 | |
| 8 | PRIORS | 1.000 | 1.000 | 1.000 | |
| 9 | EIGENVAL | 2.405 | 0.437 | 0.159 | |
| 10 | PATTERN | Factor1 | 0.939 | 0.910 | 0.834 |
| 11 | SCORE | Factor1 | 0.390 | 0.378 | 0.347 |
Figure 82.2 lists the first two observations of the original SAS data set (Schools).
Figure 82.2: First Two Observations of the Schools Data Set
| First Two Observations of the DATA= Data Set from PROC SCORE |
| Obs | Type | English | Math | Biology |
|---|---|---|---|---|
| 1 | p | 52 | 55 | 45 |
| 2 | p | 42 | 49 | 40 |
Figure 82.3 lists the first two observations of the output data set New created by PROC SCORE.
Figure 82.3: Listing of the New Data Set
| First Two Observations of the OUT= Data Set from PROC SCORE |
| Obs | Type | Factor1 |
|---|---|---|
| 1 | p | -0.17604 |
| 2 | p | -0.80294 |
The score variable Factor1 in the New data set is named according to the value of the _NAME_ variable in the Scores data set. The values of the variable Factor1 are computed as follows: the DATA= data set variables are standardized using the same means and standard deviations that
PROC FACTOR used when extracting the factors because the Scores data set contains observations with _TYPE_=’MEAN’ and _TYPE_=’STD’.
Note that in order to correctly use standardized scoring coefficients created by other procedures such as PROC FACTOR in this example, the data to be scored must be standardized in the same way that the data were standardized when the scoring coefficients were computed. Otherwise, the resulting scores might be incorrect. PROC SCORE does this automatically if the SCORE= data set is the original OUTSTAT= data set output from the procedure creating the scoring coefficients.
These standardized variables are then multiplied by their respective standardized scoring coefficients from the data set Scores. These products are summed over all three variables, and the sum is the value of the new variable Factor1. The first two values of the scored variable Factor1 are obtained as follows:
|
|
|
|
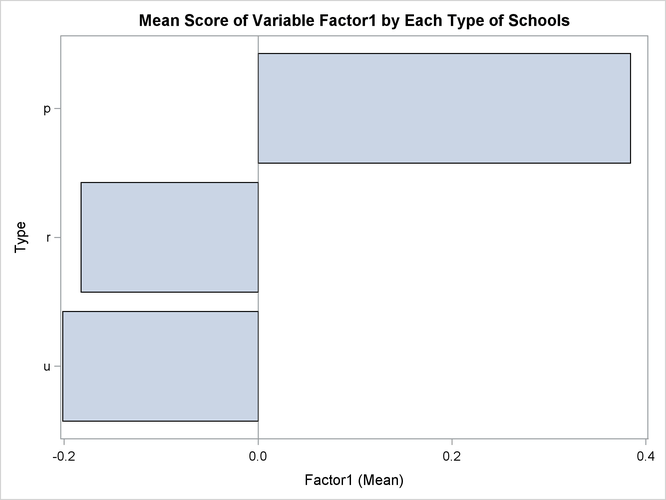
The following statements request that the SGPLOT procedure produce a horizontal bar chart of the variable Type. The length of each bar represents the mean of the variable Factor1.
title 'Mean Score of Variable Factor1 by Each Type of Schools';
proc sgplot data=New;
   hbar type / stat = mean response=Factor1;
run;
Figure 82.4 displays the mean score of the variable Factor1 for each of the three school types. For private schools (Type=p), the average value of the variable Factor1 is 0.384, while for state-run schools the average values are much lower. The state-run urban schools (Type=u) have the lowest mean value of –0.202, and the state-run rural schools (Type=r) have a mean value of –0.183.
Figure 82.4: Bar Chart of School Type