The SGPANEL Procedure
The SGPANEL procedure creates paneled plots and charts with one or more classification variables. Classification variables can be designated as row or column variables, or there can be multiple classifications. Graphs are drawn for each combination of the levels of classification variables, showing a subset of the data in each cell.
This example is taken from Example 41.6 of Chapter 41: The GLIMMIX Procedure. The following statements create the input SAS data sets:
data times;
   input time1-time23;
   datalines;
122  150  166  179  219  247  276  296  324  354  380  445
478  508  536  569  599  627  655  668  723  751  781
;

data cows;
   if _n_ = 1 then merge times;
   array t{23} time1 - time23;
   array w{23} weight1 - weight23;
   input cow iron infection weight1-weight23 @@;
   do i=1 to 23;
      weight = w{i};
      tpoint = (t{i}-t{1})/10;
      output;
   end;
   keep cow iron infection tpoint weight;
   datalines;
 1 0 0  4.7    4.905  5.011  5.075  5.136  5.165  5.298  5.323
        5.416  5.438  5.541  5.652  5.687  5.737  5.814  5.799
        5.784  5.844  5.886  5.914  5.979  5.927  5.94
 2 0 0  4.868  5.075  5.193  5.22   5.298  5.416  5.481  5.521

   ... more lines ...

;
First, PROC GLIMMIX is run to fit the model, and then the results are prepared for plotting:
proc glimmix data=cows;
   t2 = tpoint / 100;
   class cow iron infection;
   model weight = iron infection iron*infection tpoint;
   random t2 / type=rsmooth subject=cow
                    knotmethod=kdtree(bucket=100 knotinfo);
   output out=gmxout pred(blup)=pred;
   nloptions tech=newrap;
run;

data plot;
   set gmxout;
   length Group $ 26;
   if      (iron=0) and (infection=0) then group='Control Group (n=4)';
   else if (iron=1) and (infection=0) then group='Iron - No Infection (n=3)';
   else if (iron=0) and (infection=1) then group='No Iron - Infection (n=9)';
   else group = 'Iron - Infection (n=10)';
run;

proc sort data=plot; by group cow;
run;
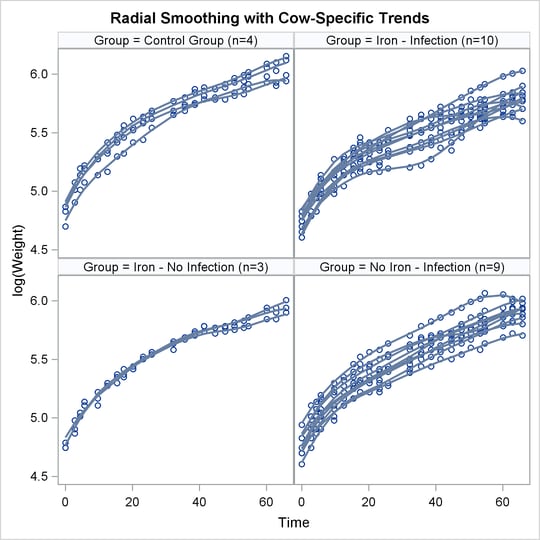
The following statements produce graphs of the observed data and fitted profiles in the four groups:
proc sgpanel data=plot noautolegend;
   title 'Radial Smoothing with Cow-Specific Trends';
   label tpoint='Time' weight='log(Weight)';
   panelby group / columns=2 rows=2;
   scatter x=tpoint y=weight;
   series  x=tpoint y=pred / group=cow lineattrs=GraphFit;
run;
The results are shown in Figure 21.63.
Figure 21.63: Fit Using PROC SGPANEL