Changing Fonts
You can change the fonts for the axis labels by using the LABELATTRS= option for both the X and Y axes. You can change the fonts for the tick values by using the TICKVALUEATTRS= option for both the X and Y axes. The following steps illustrate:
%SurvivalTemplateRestore

%let yOptions   = label="Survival Probability"
                  shortlabel="Survival"
                  labelattrs=(size=12pt weight=bold)
                  tickvalueattrs=(size=8pt weight=bold)
                  linearopts=(viewmin=0 viewmax=1
                              tickvaluelist=(0 .2 .4 .6 .8 1.0));

%let xOptions   = shortlabel=XNAME
                  offsetmin=.05
                  labelattrs=(size=12pt weight=bold)
                  tickvalueattrs=(size=8pt weight=bold)
                  linearopts=(viewmax=MAXTIME tickvaluelist=XTICKVALS
                              tickvaluefitpolicy=XTICKVALFITPOL);
%SurvivalTemplate

proc lifetest data=sashelp.BMT plots=survival(atrisk=0 to 2500 by 500);
   ods select SurvivalPlot;
   time T * Status(0);
   strata Group;
run;
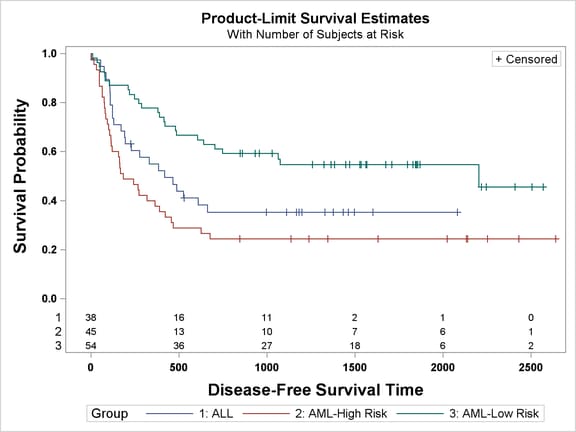
These steps create axis label fonts that are greater than the default (12-point rather than 10-point) and are bold. The tick value fonts are smaller than the default (8-point rather than 9-point) and again are bold. The results are displayed in Output 22.3.9.
You can restore the default macros, macro variables, and template by running the following steps:
%SurvivalTemplateRestore

proc template;
   delete Stat.Lifetest.Graphics.ProductLimitSurvival;
run;
Instead of changing a graph template to change fonts, you can change the fonts by modifying the ODS style. The following steps write the HTMLBLUE style and its parent style STATISTICAL to a file and display only those lines that pertain to fonts:
filename temp1 'temp1.tpl' lrecl=100;
filename temp2 'temp2.tpl' lrecl=100;
filename temp  ('temp1.tpl' 'temp2.tpl') lrecl=100;

proc template;
   source styles.htmlblue    / file=temp1;
   source styles.statistical / file=temp2;
run;
data _null_;
   infile temp pad;
   input line $ 1-100;
   file print;
   if index(lowcase(line), 'font') then put line;
run;
The results are displayed in Output 22.3.10.
style fonts /
'TitleFont2' = ("<sans-serif>, <MTsans-serif>, Helvetica, Helv",2,bold)
'TitleFont' = ("<sans-serif>, <MTsans-serif>, Helvetica, Helv",3,bold)
'StrongFont' = ("<sans-serif>, <MTsans-serif>, Helvetica, Helv",2,bold)
'EmphasisFont' = ("<sans-serif>, <MTsans-serif>, Helvetica, Helv",2,italic)
'FixedFont' = ("<monospace>, Courier",2)
'BatchFixedFont' = ("SAS Monospace, <monospace>, Courier, monospace",2)
'FixedHeadingFont' = ("<monospace>, Courier, monospace",2)
'FixedStrongFont' = ("<monospace>, Courier, monospace",2,bold)
'FixedEmphasisFont' = ("<monospace>, Courier, monospace",2,italic)
'headingEmphasisFont' = ("<sans-serif>, <MTsans-serif>, Helvetica, Helv",2,bold
italic)
'headingFont' = ("<sans-serif>, <MTsans-serif>, Helvetica, Helv",2,bold)
'docFont' = ("<sans-serif>, <MTsans-serif>, Helvetica, Helv",2);
style GraphFonts /
'GraphDataFont' = ("<sans-serif>, <MTsans-serif>",7pt)
'GraphUnicodeFont' = ("<MTsans-serif-unicode>",9pt)
'GraphValueFont' = ("<sans-serif>, <MTsans-serif>",9pt)
'GraphLabelFont' = ("<sans-serif>, <MTsans-serif>",10pt)
'GraphFootnoteFont' = ("<sans-serif>, <MTsans-serif>",10pt,italic)
'GraphTitleFont' = ("<sans-serif>, <MTsans-serif>",11pt,bold)
'GraphTitle1Font' = ("<sans-serif>, <MTsans-serif>",14pt,bold)
'GraphAnnoFont' = ("<sans-serif>, <MTsans-serif>",10pt);
font = fonts('HeadingFont')
font = fonts('DocFont')
font = Fonts('headingEmphasisFont');
font = Fonts('TitleFont2');
font = Fonts('docFont');
|
If neither of these styles contains the right information, you can also display the DEFAULT style, which is the parent of the STATISTICAL style, as follows:
filename temp1 'temp1.tpl' lrecl=100;
filename temp2 'temp2.tpl' lrecl=100;
filename temp3 'temp3.tpl' lrecl=100;
filename temp  ('temp1.tpl' 'temp2.tpl' 'temp3.tpl') lrecl=100;

proc template;
   source styles.htmlblue    / file=temp1;
   source styles.statistical / file=temp2;
   source styles.default     / file=temp3;
run;
data _null_;
   infile temp pad;
   input line $ 1-100;
   file print;
   if index(lowcase(line), 'font') then put line;
run;
The results of this step are not shown.
The following step creates a new style, STATBIGFONT, that redefines the GraphLabelFont style element from an ordinary 10-point font to a bold 12-point font and the GraphValueFont style element from an ordinary 9-point font to a bold 8-point font:
proc template;
   define style Styles.StatBigFont;
      parent = Styles.HTMLBlue;
      style graphfonts from graphfonts /
         'GraphLabelFont' = ("<sans-serif>, <MTsans-serif>",12pt,bold)
         'GraphValueFont' = ("<sans-serif>, <MTsans-serif>",8pt,bold);
   end;
run;
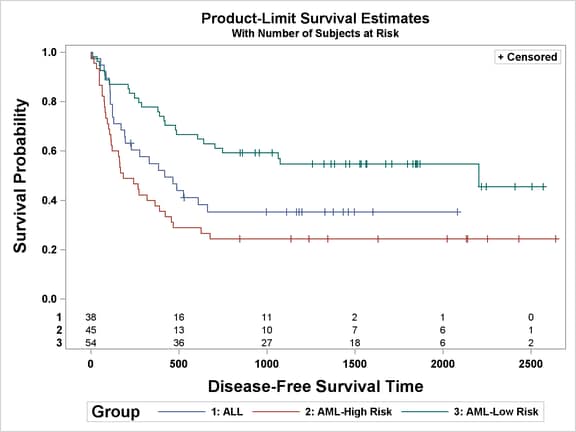
The following step creates the graph that is displayed in Output 22.3.11:
ods listing style=StatBigFont;

proc lifetest data=sashelp.BMT plots=survival(atrisk=0 to 2500 by 500);
   ods select SurvivalPlot;
   time T * Status(0);
   strata Group;
run;
The graph displayed in Output 22.3.11 is almost identical to the one displayed in Output 22.3.9. They differ since the GraphLabelFont style element also controls the title for the legend, and the GraphValueFont style element also controls the labels for the at-risk information table.
You can delete the new style template as follows:
proc template;
   delete Styles.StatBigFont;
run;