The SURVEYPHREG Procedure
- Overview
- Getting Started
-
Syntax
 PROC SURVEYPHREG Statement BY Statement CLASS Statement CLUSTER Statement DOMAIN Statement ESTIMATE Statement FREQ Statement LSMEANS Statement LSMESTIMATE Statement MODEL Statement NLOPTIONS Statement OUTPUT Statement Programming Statements REPWEIGHTS Statement SLICE Statement STORE Statement STRATA Statement TEST Statement WEIGHT Statement
 -
Details
Notation and Estimation Failure Time Distribution Time and CLASS Variables Usage Partial Likelihood Function for the Cox Model Specifying the Sample Design Missing Values Variance Estimation Domain Analysis Hypothesis Tests, Confidence Intervals, and Residuals Output Data Sets Displayed Output ODS Table Names ODS Graphics
-
Examples
- References
| Notation and Estimation |
Let  be the set of indices and let
  be the set of values for a finite population of size N. The survival time of each member of the finite population is assumed to follow its own hazard function,
  , expressed as
 |
where  is an arbitrary and unspecified baseline hazard function,
  is the vector of explanatory variables for the
  th unit at time
  , and
, and  is the vector of unknown regression parameters that are associated with the explanatory variables. The vector is assumed to be the same for all individuals.
The partial likelihood function introduced by Cox (1972, 1975) eliminates the unknown baseline hazard and accounts for censored survival times. If the entire population is observed, then this partial likelihood can be used to estimate . Let  be the desired estimator. Assuming a working model with uncorrelated responses, is obtained by maximizing the partial log likelihood,
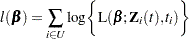 |
with respect to , where L is Cox’s partial likelihood function.
Assume that probability sample  is selected from the finite population
  and
and  is the selection probability for unit . Further assume that covariates
  and survival time
  are available for every unit in the sample . An estimator of the finite population log likelihood is
 |
See Partial Likelihood Function for the Cox Model for more details.
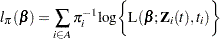
A sample-based estimator  for the finite population quantity can be obtained by maximizing the partial pseudo-log-likelihood
  with respect to . The design-based variance for
  is obtained by assuming the set of finite population values as fixed. For more information about maximum psuedo-likelihood estimators and other inferential approaches for survey data, see Kish and Frankel (1974), Godambe and Thompson (1986), Pfeffermann (1993), Korn and Graubard (1999, chapter 3), Chamber and Skinner (2003, chapter 2), and Fuller (2009, section 6.5). Maximum pseudo-likelihood estimators and their properties for Cox’s proportional hazards model for survey data are discussed in Binder (1990, 1992), Lin and Wei (1989), Lin (2000), and Boudreau and Lawless (2006).
Without loss of generality, the rest of this section uses indices for stratified clustered designs. For a stratified clustered sample design, observations are represented by a matrix
 |
where
 denotes the vector of sampling weights
  denotes the event time variable
  denotes the event indicator
  denotes the
  matrix of auxiliary information
  is the stratum index
  is the cluster index within stratum
 is the unit index within cluster of stratum
  is the total number of parameters
  is the total number of observations in the sample
  , where
  is an indicator function
  , where is an indicator function
Let  denote the summation over the set of indices such that the observation unit
  in PSU and stratum belongs to the index set
  . Typically, is the set of all population indices that are in the sample, the risk set, or the set of all units with a failure.
The first-stage sampling rate (fraction of PSUs selected for the sample) is denoted by  . The first-stage sampling rate is used in Taylor series variance estimation. You can specify the stratum sampling rates with the RATE= option. Or if you specify population totals with the TOTAL= option, PROC SURVEYFREQ computes as the ratio of stratum sample size to the stratum total, in terms of PSUs. See the section Population Totals and Sampling Rates for details. If you do not specify the RATE= option or the TOTAL= option, then the procedure assumes that the stratum sampling rates are negligible and does not use a finite population correction when computing variances.