The PLS Procedure

Example 69.2 Examining Outliers
This example is a continuation of Example 69.1.
Standard diagnostics for statistical models focus on the response, allowing you to look for patterns that indicate the model is inadequate or for outliers that do not seem to follow the trend of the rest of the data. However, partial least squares effectively models the predictors as well as the responses, so you should consider the pattern of the fit for both. The DModX and DModY statistics give the distance from each point to the PLS model with respect to the predictors and the responses, respectively, and ODS Graphics enables you to plot these values. No point should be dramatically farther from the model than the rest. If there is a group of points that are all farther from the model than the rest, they might have something in common, in which case they should be analyzed separately.
The following statements fit a reduced model to the data discussed in Example 69.1 and plot a panel of standard diagnostics as well as the distances of the observations to the model.
ods graphics on;

proc pls data=pentaTrain nfac=2 plot=(diagnostics dmod);
   model log_RAI = S1    P1
                   S2
                   S3 L3 P3
                   S4 L4   ;
run;

ods graphics off;
The plots are shown in Output 69.2.1 and Output 69.2.2.
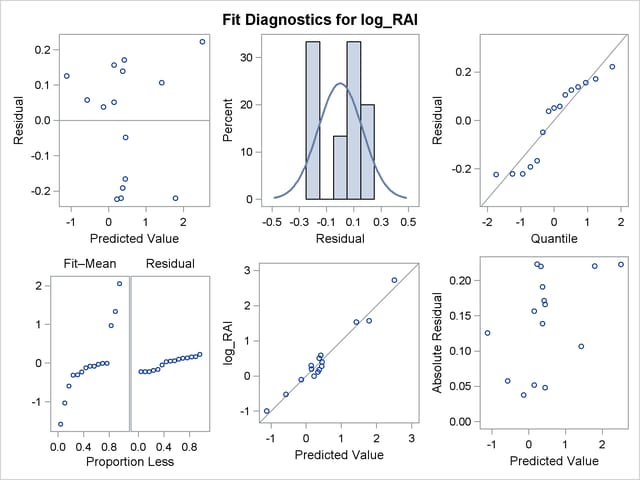
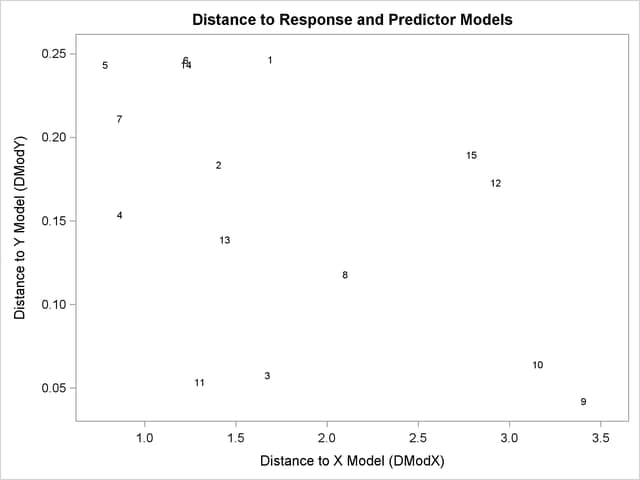
There appear to be no profound outliers in either the predictor space or the response space.