Example 21.4 Displaying Graphs Using the DOCUMENT Procedure
This example illustrates the use of the ODS DOCUMENT destination and the DOCUMENT procedure to display your ODS graphs. You can use this approach whenever you want to generate and save your output (both tables and graphs) and then display or replay it later, potentially in subsets or more than once. This approach is particularly useful when you want to display your output in multiple ODS destinations, or when you want to use different styles without rerunning your SAS program. This approach is also useful when you want to break your output into separate parts for inclusion into different parts of a document such as a LaTeX file.
Consider again the data set Stack created by the following statements:
data stack;
   input x1 x2 x3 y @@;
   datalines;
80 27 89 42   80 27 88 37   75 25 90 37   62 24 87 28   62 22 87 18
62 23 87 18   62 24 93 19   62 24 93 20   58 23 87 15   58 18 80 14
58 18 89 14   58 17 88 13   58 18 82 11   58 19 93 12   50 18 89  8
50 18 86  7   50 19 72  8   50 19 79  8   50 20 80  9   56 20 82 15
70 20 91 15
;
The following statements request a Q-Q plot from PROC ROBUSTREG with the Stack data:
ods _all_ close;
ods document name=QQDoc(write);

proc robustreg data=stack plots=qqplot;
   model y = x1 x2 x3;
run; quit;

ods document close;
ods listing;
The ODS DOCUMENT statement opens an ODS document named QQDoc. All of the results—tables, graphs, titles, notes, footnotes, headers—are stored in the ODS document. None of them are displayed since no other destination is open. In order to display the Q-Q plot with PROC DOCUMENT, you first need to determine its name. You can do this by specifying the ODS TRACE ON statement prior to the procedure statements (see the section Determining Graph Names and Labels for more information). Alternatively, you can type odsdocuments (or odsd for short) on the command line to open the Documents window, which you can then use to manage your ODS documents.
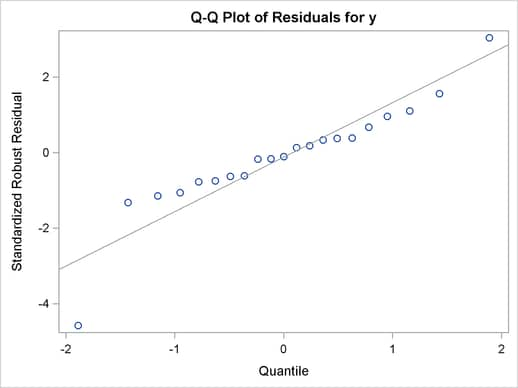
The following statements specify an HTML destination and display the residual Q-Q plot by using the REPLAY statement in PROC DOCUMENT:
ods html body='b.htm';

proc document name=QQDoc;
   ods select QQPlot;
   replay;
run; quit;

ods html close;
Subsequent steps can replay one or more objects from the same ODS document. By default, the REPLAY statement attempts to display every output object stored in the ODS document, but here only the Q-Q plot is displayed because it is specified by the ODS SELECT statement. The plot is displayed in Output 21.4.1.
As an alternative to running PROC DOCUMENT with an ODS SELECT statement, you can run PROC DOCUMENT with a document path for the Q-Q plot in the REPLAY statement. This approach is preferable when the ODS document contains a large volume of output, so that PROC DOCUMENT does not attempt to process every piece of output stored in the ODS document.
You can determine the ODS document path for the Q-Q plot by specifying the LIST statement with the LEVELS=ALL option in PROC DOCUMENT as follows:
proc document name=QQDoc;
   list / levels=all;
run; quit;
The contents of the ODS document QQDoc are shown in Output 21.4.2.
| Listing of: \Work.Qqdoc\ | ||
|---|---|---|
| Order by: Insertion | ||
| Number of levels: All | ||
| Obs | Path | Type |
| 1 | \Robustreg#1 | Dir |
| 2 | \Robustreg#1\ModelInfo#1 | Table |
| 3 | \Robustreg#1\NObs#1 | Table |
| 4 | \Robustreg#1\ParmInfo#1 | Table |
| 5 | \Robustreg#1\SummaryStatistics#1 | Table |
| 6 | \Robustreg#1\ParameterEstimates#1 | Table |
| 7 | \Robustreg#1\DiagSummary#1 | Table |
| 8 | \Robustreg#1\DiagnosticPlots#1 | Dir |
| 9 | \Robustreg#1\DiagnosticPlots#1\QQPlot#1 | Graph |
| 10 | \Robustreg#1\GoodFit#1 | Table |
The ODS document path of the QQPlot entry in the QQDoc ODS document, as shown in Output 21.4.2, is  Robustreg#1DiagnosticPlots#1QQPlot#1.
You can use this path to display the residual Q-Q plot with PROC DOCUMENT as follows:
proc document name=QQDoc;
   replay \Robustreg#1\DiagnosticPlots#1\QQPlot#1;
run; quit;
You can also determine the ODS document path from the Results window or the Documents window. Right-click the object icon and select Properties.
The SAS/STAT documentation preparation process uses the ODS document. SAS output is saved into an ODS document that is then replayed into sections of the documentation, which is prepared using LaTeX. In general, when you send your output to the DOCUMENT destination, you can use PROC DOCUMENT to rearrange, duplicate, or remove output from the results of a procedure or a database query. For more information, see the ODS DOCUMENT statement in the section "Dictionary of ODS Language Statements" and the chapter "The DOCUMENT Procedure" in the SAS Output Delivery System: User's Guide.