| The SURVEYFREQ Procedure |
Rao-Scott Chi-Square Test
The Rao-Scott chi-square test is a design-adjusted version of the Pearson chi-square test, which involves differences between observed and expected frequencies. For two-way tables, the null hypothesis for this test is no association between the row and column variables. For one-way tables, the null hypothesis is equal proportions for the variable levels. Or you can specify null hypothesis proportions for one-way tables by using the TESTP= option.
Two forms of the design correction are available for the Rao-Scott tests. One form of the design correction uses the proportion estimates, and you request the corresponding Rao-Scott chi-square test with the CHISQ option. The other form of the design correction uses the null hypothesis proportions. You request this test, called the Rao-Scott modified chi-square test, with the CHISQ1 option.
See Lohr (2009), Thomas, Singh, and Roberts (1996), and Rao and Scott (1981, 1984, 1987) for details about design-adjusted chi-square tests.
Two-Way Tables
The Rao-Scott chi-square statistic is computed from the Pearson chi-square statistic and a design correction based on the design effects of the proportions. Under the null hypothesis of no association between the row and column variables, this statistic approximately follows a chi-square distribution with  degrees of freedom, where the two-way table has
  rows and
  columns. PROC SURVEYFREQ also computes an
  statistic that can provide a better approximation.
The Rao-Scott chi-square  is computed as
 |
where  is the design correction described in the section Design Correction for Two-Way Tables, and
  is the Pearson chi-square based on the estimated totals. The Pearson chi-square is computed as
 |
where  is the sample size,
  is the estimated overall total,
  is the estimated total for table cell
  , and
, and  is the expected total for table cell under the null hypothesis of no association,
 |
Under the null hypothesis of no association, the Rao-Scott chi-square  approximately follows a chi-square distribution with degrees of freedom. A better approximation can be obtained by the statistic,
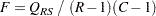 |
which has an distribution with and  degrees of freedom under the null hypothesis. The value
  is the degrees of freedom for the variance estimator and depends on the sample design and the variance estimation method. The section Degrees of Freedom describes the computation of .
Design Correction for Two-Way Tables
If you specify the CHISQ or LRCHISQ option, the design correction is computed by using the estimated proportions as
 |
 |
|||
 |
 |
where
 |
 |
 |
|||
|
|
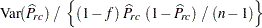 |
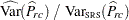
as described in the section Design Effect.  is the estimate of the proportion in table cell
  ,
,  is the variance of the estimate,
  is the overall sampling fraction, and is the number of observations in the sample.
  , the design effect for the estimate of the proportion in row
  , and
, and  , the design effect for the estimate of the proportion in column
  , are computed similarly.
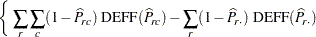
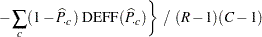
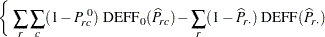
If you specify the CHISQ1 or LRCHISQ1 option for the Rao-Scott modified test, the design correction uses the null hypothesis cell proportions instead of the estimated cell proportions. For two-way tables, the null hypothesis cell proportions are computed as the products of the corresponding row and column proportion estimates. The modified design correction  (based on null hypothesis proportions) is computed as
 |
 |
|||
|
|
where
 |
and
 |
|
 |
|||
|
|
 |
One-Way Tables
For one-way tables, the Rao-Scott chi-square statistic provides a design-based goodness-of-fit test for equal proportions. Or if you specify null proportions with the TESTP= option, the Rao-Scott chi-square provides a design-based goodness-of-fit test for the specified proportions. Under the null hypothesis, the Rao-Scott chi-square statistic approximately follows a chi-square distribution with  degrees of freedom for a table with levels. PROC SURVEYFREQ also computes an statistic that can provide a better approximation.
The Rao-Scott chi-square is computed as
 |
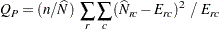
where is the design correction described in the section Design Correction for One-Way Tables, and  is the Pearson chi-square based on the estimated totals. The Pearson chi-square is computed as
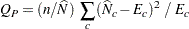 |
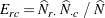
where is the sample size, is the estimated overall total,  is the estimated total for level , and
  is the expected total for level under the null hypothesis. For the null hypothesis of equal proportions, the expected total for level equals
 |
For specified null proportions, the expected total for level equals
 |
where  is the null proportion for level .
Under the null hypothesis, the Rao-Scott chi-square approximately follows a chi-square distribution with degrees of freedom. A better approximation can be obtained by the statistic,
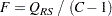 |
which has an distribution with and  degrees of freedom under the null hypothesis. The value is the degrees of freedom for the variance estimator and depends on the sample design and the variance estimation method. The section Degrees of Freedom describes the computation of .
Design Correction for One-Way Tables
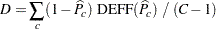
If you specify the CHISQ or LRCHISQ option, the design correction is computed by using the estimated proportions as
 |
where
 |
|
 |
|||
|
|
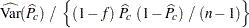 |
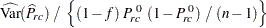
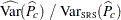
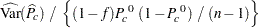
as described in the section Design Effect.  is the proportion estimate for table level ,
  is the variance of the estimate, is the overall sampling fraction, and is the number of observations in the sample.
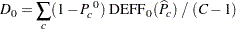
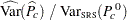
If you specify the CHISQ1 or LRCHISQ1 option for the Rao-Scott modified test, the design correction uses the null hypothesis proportions—either equal proportions for all levels, or the proportions that you specify with the TESTP= option. The modified design correction is computed as
 |
where
 |
|
 |
|||
|
|
 |
and  for equal proportions, or equals the null proportion for level if you specify the TESTP= option.
Copyright © SAS Institute, Inc. All Rights Reserved.