| Statistical Graphics Using ODS |
| Changing the Default Markers and Lines |
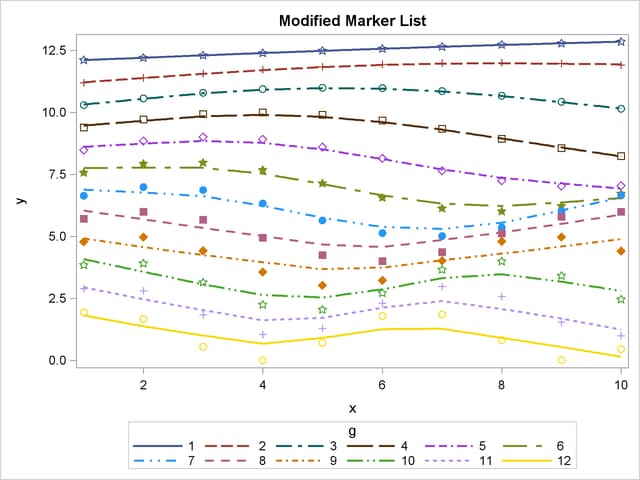
The preceding section shows how to use the %MODSTYLE autocall macro to create an all-color style. You can also use the %MODSTYLE macro to change markers and line styles. This example creates a new style called MARKSTYLE that inherits from the STATISTICAL style but uses a different set of markers. The following statements create artificial data, change the marker list, and display the results:
data x;
   do g = 1 to 12;
      do x = 1 to 10;
         y = 13 - g + sin(x * 0.1 * g);
         output;
      end;
   end;
run;

%modstyle(name=markstyle, parent=statistical, type=CLM,
          markers=star plus circle square diamond starfilled
                  circlefilled squarefilled diamondfilled)

ods listing style=markstyle;

proc sgplot;
   title 'Modified Marker List';
   loess y=y x=x / group=g;
run;
The NAME= option specifies the new style name, and the PARENT= option specifies the parent style. The TYPE= option controls the method of cycling through colors, lines, and markers. The default, TYPE=LMbyC, fixes (holds constant) the line styles and markers, while cycling through the color list. This is illustrated in the section Creating an All-Color Style by Using the ModStyle Macro. This example uses TYPE=CLM to cycle through colors, line styles, and markers (holding none of them fixed). Other TYPE= values are described in section Style Template Modification Macro. The values specified with the TYPE= option are case sensitive ('by' is lower case and the 'L', 'C', and 'M' are upper case). The new marker list is specified with the MARKERS= option. The results are displayed in Figure 21.26. The marker list is reused in the tenth and subsequent groups since only nine markers are defined.
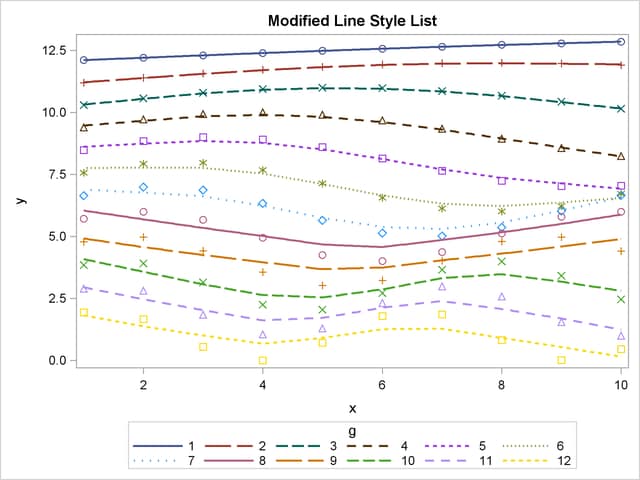
The following statements create a new style called LINESTYLE that inherits from the STATISTICAL style and changes the line list:
%modstyle(name=linestyle, parent=statistical, type=CLM,
          linestyles=Solid LongDash MediumDash Dash ShortDash Dot ThinDot)

ods listing style=linestyle;

proc sgplot;
   title 'Modified Line Style List';
   loess y=y x=x / group=g;
run;
The new line list is specified with the LINESTYLES= option. The results are displayed in Figure 21.27. In this example, each of the first seven groups uses a dash pattern that is shorter than the previous group. The line list is reused in the eighth and subsequent groups since only seven line patterns are defined.
You can learn more about style modification by examining the new styles, as in the following example:
proc template;
   source styles.markstyle;
   source styles.linestyle;
run;
The results show the definitions of GraphData1 through GraphData32 that the macro created. An abridged listing of the results follows:
   define style Styles.Markstyle;
      parent = Styles.statistical;
      . . .
      style GraphData1 /
         markersymbol = "star"
         linestyle = 1
         contrastcolor = ColorStyles('c1')
         color = FillStyles('f1');
      . . .
      style GraphData32 /
         markersymbol = "diamond"
         linestyle = 42
         contrastcolor = ColorStyles('c8')
         color = FillStyles('f8');
   end;

   define style Styles.Linestyle;
      parent = Styles.statistical;
      . . .
      style GraphData1 /
         markersymbol = "circle"
         linestyle = 1
         contrastcolor = ColorStyles('c1')
         color = FillStyles('f1');
      . . .
      style GraphData32 /
         markersymbol = "triangle"
         linestyle = 20
         contrastcolor = ColorStyles('c8')
         color = FillStyles('f8');
   end;
You can use the NUMBEROFGROUPS= option in the %MODSTYLE macro to control the number of GraphDatan style elements created in the new style.
Modifying Graph Fonts in Styles
You can modify an ODS style to customize the general appearance of plots produced with ODS Graphics, just as you can modify a style to customize the general appearance of ODS tables. This section shows you how to customize fonts used in graphs. The following statements show the STATISTICAL style:
proc template;
   source Styles.Statistical;
run;
The portion of the style that controls fonts is shown next:
   style GraphFonts /
      'GraphDataFont' = ("<sans-serif>, <MTsans-serif>",7pt)
      'GraphUnicodeFont' = ("<MTsans-serif-unicode>",9pt)
      'GraphValueFont' = ("<sans-serif>, <MTsans-serif>",9pt)
      'GraphLabelFont' = ("<sans-serif>, <MTsans-serif>",10pt)
      'GraphFootnoteFont' = ("<sans-serif>, <MTsans-serif>",10pt,italic)
      'GraphTitleFont' = ("<sans-serif>, <MTsans-serif>",11pt,bold)
      'GraphAnnoFont' = ("<sans-serif>, <MTsans-serif>",10pt);
The following fonts are the ones typically used for the text in most graphs:
GraphDataFont is the smallest font. It is used for text that needs to be small (labels for points in scatter plots, labels for contours, and so on)
GraphValueFont is the next largest font. It is used for axis value (tick marks) labels and legend entry labels.
GraphLabelFont is the next largest font. It is used for axis labels and legend titles.
GraphFootnoteFont is the next largest font. It is used for all footnotes.
GraphTitleFont is the largest font. It is used for all titles.
The following statements define a style named NEWSTYLE that replaces the graph fonts in the DEFAULT style with italic Times New Roman fonts, which are available with the Windows operating system:
proc template;
   define style Styles.NewStyle;
      parent=Styles.Statistical;
      replace GraphFonts  /
         'GraphDataFont'     = ("<MTserif>, Times New Roman",7pt)
         'GraphUnicodeFont'  = ("<MTserif>, Times New Roman",9pt)
         'GraphValueFont'    = ("<MTserif>, Times New Roman",9pt)
         'GraphLabelFont'    = ("<MTserif>, Times New Roman",10pt)
         'GraphFootnoteFont' = ("<MTserif>, Times New Roman",10pt)
         'GraphTitleFont'    = ("<MTserif>, Times New Roman",11pt)
         'GraphAnnoFont'     = ("<MTserif>, Times New Roman",10pt);
   end;
run;
For more information about the DEFINE, PARENT, and REPLACE statements, see the SAS/GRAPH Template Language Reference.
The "Getting Started" section of Chapter 75, The ROBUSTREG Procedure, creates the following data set to illustrate the use of the PROC ROBUSTREG for robust regression:
data stack;
   input  x1 x2 x3 y @@;
   datalines;
80  27  89  42    80  27  88  37    75  25  90  37

   ... more lines ...

;
The following statements create a Q-Q plot that uses the STATISTICAL style (see Figure 21.28) and the NEWSTYLE style (see Figure 21.29):
ods listing style=Statistical;
ods graphics on;

proc robustreg data=stack plots=qqplot;
   ods select QQPlot;
   model y = x1 x2 x3;
run;
ods listing close;
ods listing style=NewStyle;

proc robustreg data=stack plots=qqplot;
   ods select QQPlot;
   model y = x1 x2 x3;
run;
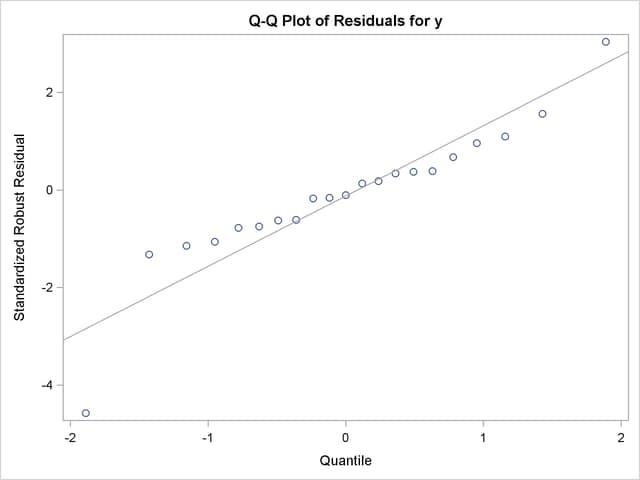
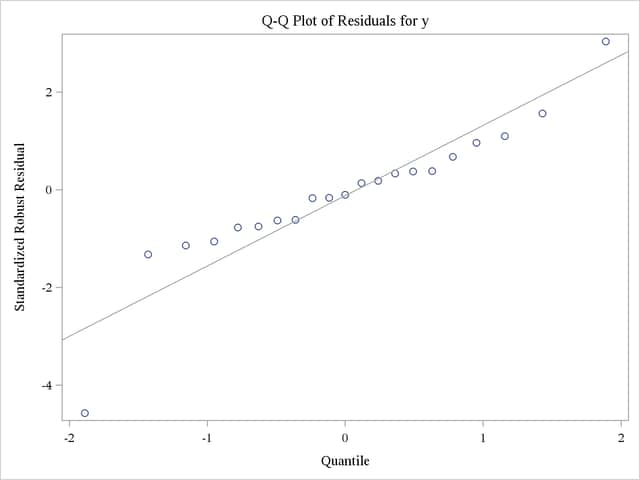
Although this example illustrates the use of a style with graphical output from a particular procedure, a style is applied to all of your output (graphs and tables) in the destination for which you specify the style. See the section Changing the Default Style for information about specifying a default style for all your output.
Modifying Other Graph Elements in Styles
This section illustrates how to modify other style elements for graphics, specifically the style element GraphReference, which controls the attributes of reference lines. You can run the following statements to learn more about the GraphReference style element:
proc template;
   source styles.statistical;
run;
The following are the first two lines of the source listing:
   define style Styles.Statistical;
      parent = styles.default;
There is no mention of GraphReference in the complete listing of the source because GraphReference is inherited from the parent style. Most styles inherit many of their attributes from other styles. To find out more, you must list the parent style, as in the following example:
proc template;
   source styles.default;
run;
Styles that you typically use with ODS Graphics inherit most of their attributes from only one style, the DEFAULT style. A few of the other styles inherit from several parents. You might have to repeat this process multiple times to find the first parent. However, with the STATISTICAL style, you only need to run this one extra step, and the results contain the following:
   class GraphReference /
      linethickness = 1px
      linestyle = 1
      contrastcolor = GraphColors('greferencelines');
To specify a line thickness of 4 pixels for all reference lines, add the following statement to the definition of the NEWSTYLE style in the section Modifying Graph Fonts in Styles:
replace GraphReference / linethickness=4px;
The following statements modify the style and produce the Q-Q plot shown in Figure 21.30:
proc template;
   define style Styles.NewStyle;
      parent=Styles.Statistical;
      replace GraphFonts  /
         'GraphDataFont'     = ("<MTserif>, Times New Roman",7pt)
         'GraphUnicodeFont'  = ("<MTserif>, Times New Roman",9pt)
         'GraphValueFont'    = ("<MTserif>, Times New Roman",9pt)
         'GraphLabelFont'    = ("<MTserif>, Times New Roman",10pt)
         'GraphFootnoteFont' = ("<MTserif>, Times New Roman",10pt)
         'GraphTitleFont'    = ("<MTserif>, Times New Roman",11pt)
         'GraphAnnoFont'     = ("<MTserif>, Times New Roman",10pt);
      replace GraphReference / linethickness=4px;
   end;
run;
ods listing style=NewStyle;
ods graphics on;

proc robustreg data=stack plots=qqplot;
   ods select QQPlot;
   model y = x1 x2 x3;
run;
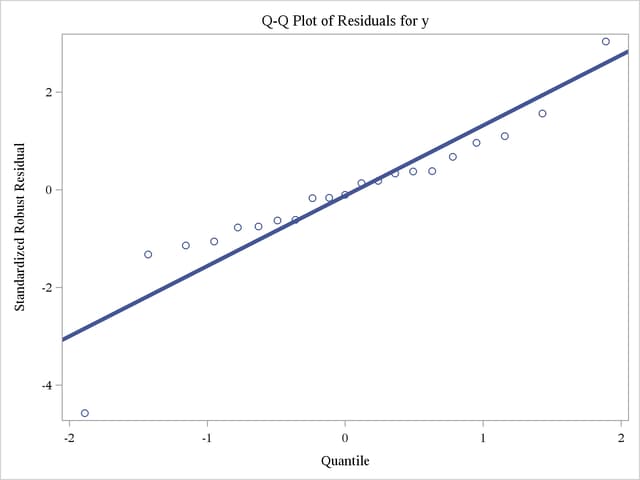
You can use this approach to modify other attributes of the line, such as LineStyle and ContrastColor. These style modifications apply to all graphs that display reference lines, and not just to Q-Q plots produced by PROC ROBUSTREG. You can control the attributes of specific graphs by modifying the graph template, as discussed in the section Graph Templates. Values specified directly in a graph template override style attributes.
When you are done with the NEWSTYLE style, you do not need to restore the STATISTICAL style template since you did not modify it. Rather, you inherited from the STATISTICAL style.
Copyright © SAS Institute, Inc. All Rights Reserved.