| Statistical Graphics Using ODS |
| Grouped Scatter Plot with PROC SGPLOT |
This example is taken from Example 31.1 of Chapter 31, The DISCRIM Procedure. The following statements create a SAS data set from the iris data:
proc format;
   value specname
      1='Setosa    '
      2='Versicolor'
      3='Virginica ';
run;

data iris;
   input SepalLength SepalWidth PetalLength PetalWidth
         Species @@;
   format Species specname.;
   label SepalLength='Sepal Length in mm.'
         SepalWidth ='Sepal Width in mm.'
         PetalLength='Petal Length in mm.'
         PetalWidth ='Petal Width in mm.';
   datalines;
50 33 14 02 1 64 28 56 22 3 65 28 46 15 2 67 31 56 24 3

   ... more lines ...

;
The following statements set the output style to LISTING and run PROC SGPLOT to make a scatter plot, grouped by iris species:
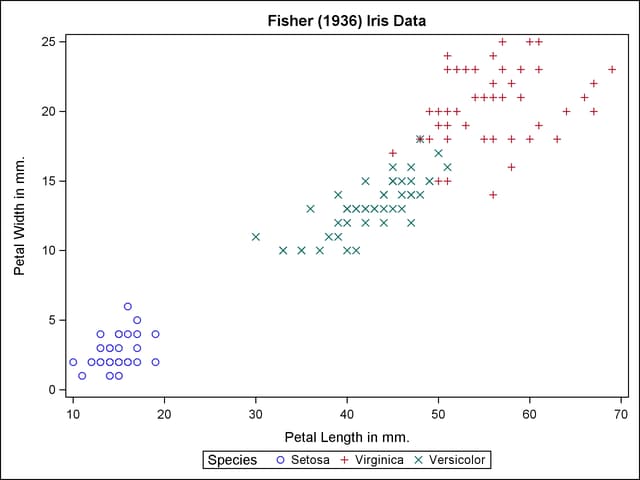
ods listing style=listing;

proc sgplot data=iris;
   title 'Fisher (1936) Iris Data';
   scatter x=petallength y=petalwidth / group=species;
run;
The results are shown in Figure 21.12.
Figure 21.12
Scatter Plot That Uses the LISTING Style
See the section Statistical Graphics Procedures and the SAS/GRAPH: Statistical Graphics Procedures Guide for more information about PROC SGPLOT (statistical graphics plot) and other SG procedures. You do not need to enable ODS Graphics in order to use SG procedures (because making plots with ODS Graphics is their sole function).
Copyright © SAS Institute, Inc. All Rights Reserved.