| Statistical Graphics Using ODS |
Example 21.8 Customizing Axes and Reference Lines
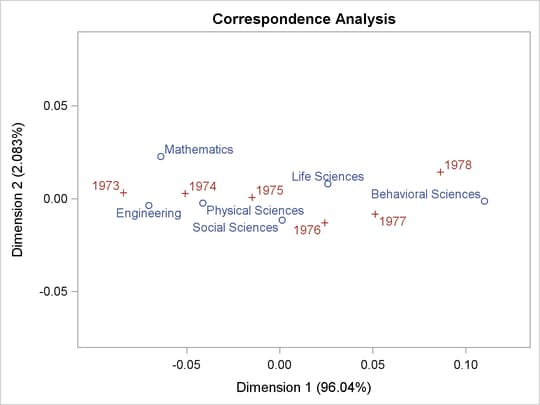
This example illustrates several ways that you can change the plot axes in a scatter plot. The example uses PROC CORRESP to perform a correspondence analysis. It is taken from the section Getting Started: CORRESP Procedure of Chapter 30, The CORRESP Procedure. It uses the following data:
title "Number of Ph.D.'s Awarded from 1973 to 1978";

data PhD;
   input Science $ 1-19 y1973-y1978;
   label y1973 = '1973'
         y1974 = '1974'
         y1975 = '1975'
         y1976 = '1976'
         y1977 = '1977'
         y1978 = '1978';
   datalines;
Life Sciences       4489 4303 4402 4350 4266 4361
Physical Sciences   4101 3800 3749 3572 3410 3234
Social Sciences     3354 3286 3344 3278 3137 3008
Behavioral Sciences 2444 2587 2749 2878 2960 3049
Engineering         3338 3144 2959 2791 2641 2432
Mathematics         1222 1196 1149 1003  959  959
;
The following steps perform the correspondence analysis and create Output 21.8.1:
ods graphics on;
ods trace on;

proc corresp data=PhD short;
   ods select configplot;
   var y1973-y1978;
   id Science;
run;
The trace output for this step (not shown) shows that the template for this plot is Stat.Corresp.Graphics.Configuration. The following step displays this template:
proc template;
   source Stat.Corresp.Graphics.Configuration;
run;
The results are as follows:
   define statgraph Stat.Corresp.Graphics.Configuration;
      dynamic xVar yVar head legend;
      begingraph;
         entrytitle HEAD;
         layout overlayequated / equatetype=fit xaxisopts=(offsetmin=0.1
            offsetmax=0.1) yaxisopts=(offsetmin=0.1 offsetmax=0.1);
            scatterplot y=YVAR x=XVAR / group=GROUP index=INDEX
               datalabel=LABEL datalabelattrs=GRAPHVALUETEXT
               name="Type" tip=(y x datalabel group)
               tiplabel=(group="Point");
            if (LEGEND)
               discretelegend "Type";
            endif;
         endlayout;
      endgraph;
   end;
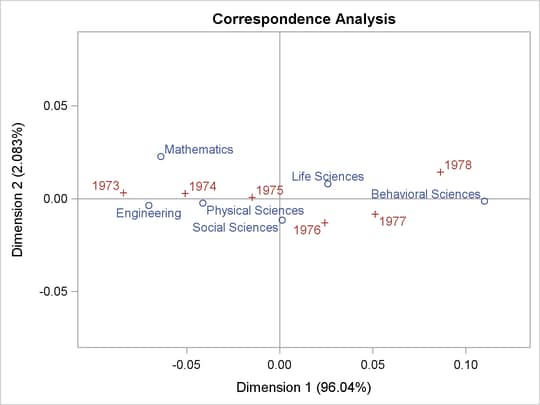
You can add reference lines to the scatter plot at specified X and Y values by using the REFERENCELINE statement, as in the following example:
proc template;
   define statgraph Stat.Corresp.Graphics.Configuration;
      dynamic xVar yVar head legend;
      begingraph;
         entrytitle HEAD;
         layout overlayequated / equatetype=fit xaxisopts=(offsetmin=0.1
            offsetmax=0.1) yaxisopts=(offsetmin=0.1 offsetmax=0.1);

            referenceline x=0;
            referenceline y=0;

            scatterplot y=YVAR x=XVAR / group=GROUP index=INDEX
               datalabel=LABEL datalabelattrs=GRAPHVALUETEXT
               name="Type" tip=(y x datalabel group)
               tiplabel=(group="Point");
            if (LEGEND)
               discretelegend "Type";
            endif;
         endlayout;
      endgraph;
   end;
run;

proc corresp data=PhD short;
   ods select configplot;
   var y1973-y1978;
   id Science;
run;
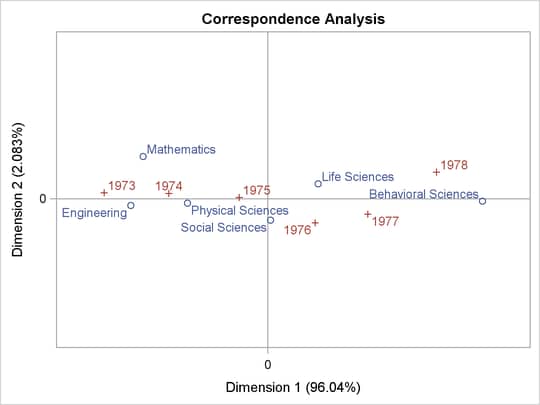
When you modify templates, it is important to note that the order of the statements within the LAYOUT OVERLAYEQUATED (or more typically, the LAYOUT OVERLAY) is significant. Here, the reference lines are added before the scatter plot so that the reference lines are drawn before the scatter plot. Consequently, labels and markers that coincide with the reference lines are drawn over the reference lines. The results, with reference lines, are displayed in Output 21.8.2.
You can restore the default graph template as follows:
proc template;
   delete Stat.Corresp.Graphics.Configuration;
run;
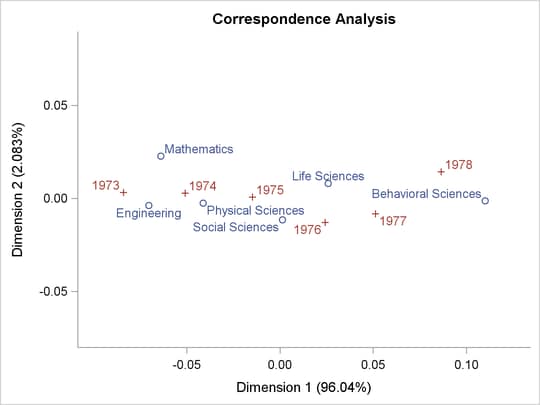
The next steps show how you can change the style so that a frame is not shown:
proc template;
   define style noframe;
      parent=styles.statistical;
      style graphwalls from graphwalls / frameborder=off;
   end;
run;

ods listing style=noframe;

proc corresp data=PhD short;
   ods select configplot;
   var y1973-y1978;
   id Science;
run;
The results, shown in Output 21.8.3, display an X-axis and a Y-axis without a frame. Unlike the previous change, which affects only the ConfigPlot display, this change affects all plots created with the NOFRAME style.
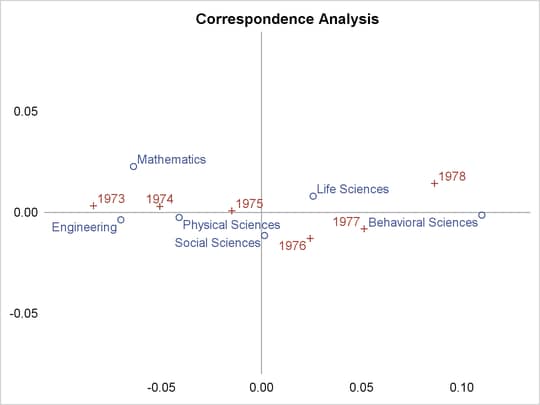
Alternatively, you can also add reference lines and delete the entire axis frame using the WALLDISPLAY=NONE and the DISPLAY= option in the graph template, as in the following example:
proc template;
   define statgraph Stat.Corresp.Graphics.Configuration;
      dynamic xVar yVar head legend;
      begingraph;
         entrytitle HEAD;

         layout overlayequated / equatetype=fit walldisplay=none
            xaxisopts=(display=(tickvalues) offsetmin=0.1 offsetmax=0.1)
            yaxisopts=(display=(tickvalues) offsetmin=0.1 offsetmax=0.1);

            referenceline x=0;
            referenceline y=0;

            scatterplot y=YVAR x=XVAR / group=GROUP index=INDEX
               datalabel=LABEL datalabelattrs=GRAPHVALUETEXT
               name="Type" tip=(y x datalabel group)
               tiplabel=(group="Point");
            if (LEGEND)
               discretelegend "Type";
            endif;
         endlayout;
      endgraph;
   end;
run;

ods listing style=statistical;

proc corresp data=PhD short;
   ods select configplot;
   var y1973-y1978;
   id Science;
run;
The results are shown in Output 21.8.4.
Instead of DISPLAY=(TICKVALUES), you can use DISPLAY=NONE (not shown) to remove the tick values from the display as well. You can change the tick values, as in the following example:
proc template;
   define statgraph Stat.Corresp.Graphics.Configuration;
      dynamic xVar yVar head legend;
      begingraph;
         entrytitle HEAD;

         layout overlayequated / equatetype=fit
            commonaxisopts=(tickvaluelist=(0))
            xaxisopts=(offsetmin=0.1 offsetmax=0.1)
            yaxisopts=(offsetmin=0.1 offsetmax=0.1);

            referenceline x=0;
            referenceline y=0;

            scatterplot y=YVAR x=XVAR / group=GROUP index=INDEX
               datalabel=LABEL datalabelattrs=GRAPHVALUETEXT
               name="Type" tip=(y x datalabel group)
               tiplabel=(group="Point");
            if (LEGEND)
               discretelegend "Type";
            endif;
         endlayout;
      endgraph;
   end;
run;

proc corresp data=PhD short;
   ods select configplot;
   var y1973-y1978;
   id Science;
run;
Since the axes in this plot are equated, the ticks are specified using the option commonaxisopts=(tickvaluelist=(tick-value-list)). This example only shows ticks at zero, but you can specify lists of values instead. The results are shown in Output 21.8.5.
If the axes are not equated, then the tick value list is specified with the LINEAROPTS= option, as in the following statement:
layout overlay / xaxisopts=(linearopts=(viewmin=-0.1 viewmax=0.1
                                        tickvaluelist=(-0.1 0 0.1))
                            offsetmin=0.1 offsetmax=0.1)
                 yaxisopts=(linearopts=(viewmin=-0.1 viewmax=0.1
                                        tickvaluelist=(-0.1 0 0.1))
                            offsetmin=0.1 offsetmax=0.1);
The preceding statement uses the VIEWMIN= and VIEWMAX= options to specify the beginning and end of the data range that is shown. Specifying a tick value list does not extend or restrict the range of data shown in the plot. When axes share common options, it might be more convenient to use a macro to specify the options. The following two statements are equivalent to the preceding statement:
%let opts = linearopts=(viewmin=-0.1 viewmax=0.1
            tickvaluelist=(-0.1 0 0.1)) offsetmin=0.1 offsetmax=0.1;
layout overlay / xaxisopts=(&opts) yaxisopts=(&opts);
You can restore the default graph template as follows:
proc template;
   delete Stat.Corresp.Graphics.Configuration;
run;
Copyright © SAS Institute, Inc. All Rights Reserved.