| Statistical Graphics Using ODS |
Modifying the Axes, Legend, and Inset Table
You can also change other aspects of this plot. The template options linearopts=(viewmin=0 viewmax=1 tickvaluelist=(0 .2 .4 .6 .8 1.0)) control the minimum value displayed, the maximum value displayed, and the ticks. You can change the range of the vertical axis or the ticks by changing this option everywhere that it occurs. The following specification changes the ticks but not the range of values: linearopts=(viewmin=0 viewmax=1 tickvaluelist=(0 .25 .5 .75 1.0)).
There are many other features of this template that you can easily modify. For example, you can change the locations of the inset table and the legend, which are controlled by the following two statements, respectively:
layout gridded / rows=2 autoalign=(TOPRIGHT BOTTOMLEFT TOP BOTTOM)
                 border=true BackgroundColor=GraphWalls:Color Opaque=true;

DiscreteLegend "Survival" / title=GROUPNAME location=outside;
The LAYOUT GRIDDED statement produces the two-row inset table displayed in the top right corner. The AUTOALIGN= option provides the preferred locations inside the plot for this table, ordered from most preferred to least preferred. You can add new locations or rearrange the existing locations. The DISCRETELEGEND statement places the legend outside of the plot. You can move it inside and print only one legend entry across each row instead of three. This has the effect of changing the orientation of the legend from a row to a column. The modified statements are as follows:
layout gridded / rows=2
   autoalign=(BottomRight TOPRIGHT BOTTOMLEFT TOP BOTTOM)
    border=true BackgroundColor=GraphWalls:Color Opaque=true;

DiscreteLegend "Survival" / title=GROUPNAME across=1 location=inside
    autoalign=(TopRight BottomLeft Top Bottom);
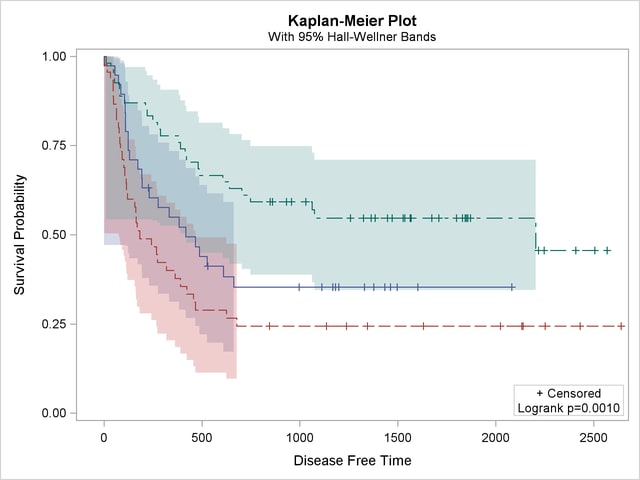
The full template with these modifications is not shown here, but the new template along with the following statements produce Output 21.6.2:
proc lifetest data=BMT plots=survival(cb=hw test);
   time T * Status(0);
   strata Group / test=logrank;
run;
You can restore the default template by running the following step:
proc template;
   delete Stat.Lifetest.Graphics.ProductLimitSurvival;
run;
Copyright © SAS Institute, Inc. All Rights Reserved.