| Statistical Graphics Using ODS |
Modifying Graph Titles and Axis Labels
This section illustrates the discussion in the section Graph Templates in the context of changing the default title and Y-axis label for a Q-Q plot created with PROC ROBUSTREG. Consider again the data set Stack created by the following statements:
data stack;
   input  x1 x2 x3 y @@;
   datalines;
80  27  89  42    80  27  88  37    75  25  90  37

   ... more lines ...

;
The following statements request a Q-Q plot for robust residuals created by PROC ROBUSTREG:
ods trace on;
ods graphics on;

proc robustreg data=stack plots=qqplot;
   ods select QQPlot;
   model y = x1 x2 x3;
run;

ods trace off;
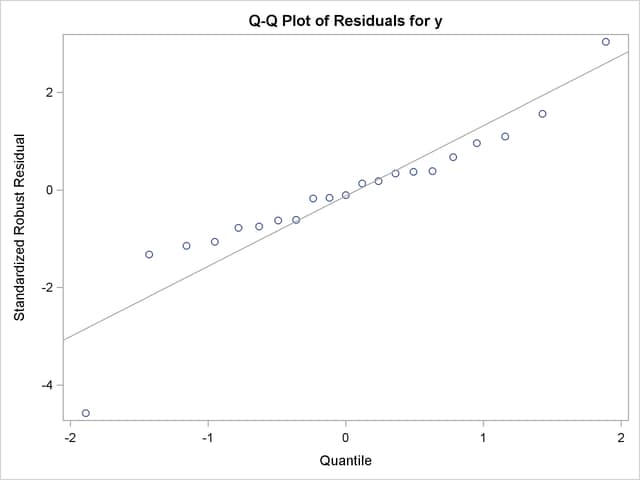
The Q-Q plot is shown in Output 21.5.1.
The ODS TRACE ON statement requests a record of all the ODS output objects created by PROC ROBUSTREG. The trace output is as follows:
Output Added:
-------------
Name:       QQPlot
Label:      Residual Q-Q Plot
Template:   Stat.Robustreg.Graphics.QQPlot
Path:       Robustreg.DiagnosticPlots.QQPlot
-------------
ODS Graphics creates the Q-Q plot from an ODS data object named QQPlot and a graph template named Stat.Robustreg.Graphics.QQPlot, which is the default template provided by SAS. Default templates supplied by SAS are saved in the SASHELP.Tmplmst template store (see the section Graph Templates).
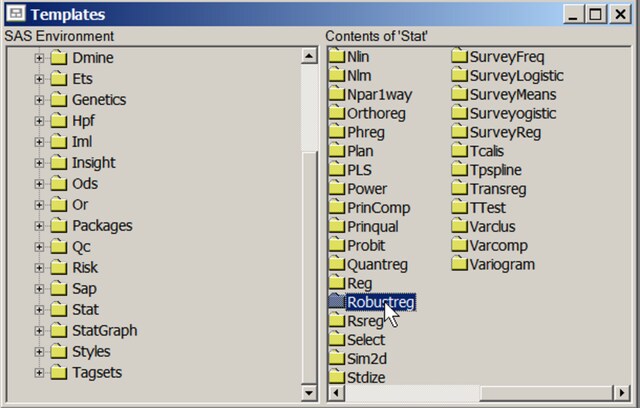
To display the default template definition, open the Templates window by typing odstemplates (or odst for short) in the command line. Expand SASHELP.Tmplmst and click the Stat folder. Output 21.5.2 shows the contents of the Stat folder.
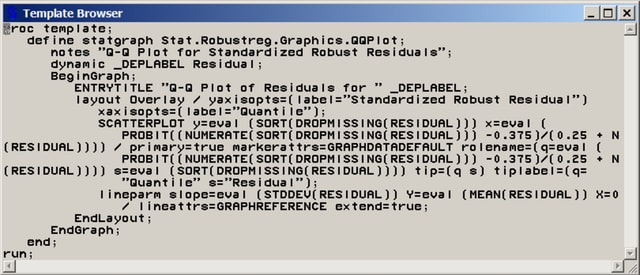
Next, open the Robustreg folder and then open the Graphics folder. Then right-click the QQPlot template icon and select Open. This opens the Template Browser window shown in Output 21.5.3. You can copy this template to an editor to edit it.
Alternatively, you can submit the following statements to display the QQPlot template definition in the SAS log:
proc template;
   source Stat.Robustreg.Graphics.QQPlot;
run;
The SOURCE statement specifies the fully qualified template name. You can copy and paste the template source into the Program Editor and modify it. The template, with a PROC TEMPLATE and RUN statement added, is shown next:
proc template;
   define statgraph Stat.Robustreg.Graphics.QQPlot;
      notes "Q-Q Plot for Standardized Robust Residuals";
      dynamic _DEPLABEL Residual;
      BeginGraph;
         ENTRYTITLE "Q-Q Plot of Residuals for " _DEPLABEL;
         layout Overlay / yaxisopts=(label="Standardized Robust Residual")
            xaxisopts=(label="Quantile");
            SCATTERPLOT y=eval (SORT(DROPMISSING(RESIDUAL))) x=eval (
               PROBIT((NUMERATE(SORT(DROPMISSING(RESIDUAL))) -0.375)/(0.25
               + N(RESIDUAL)))) / primary=true markerattrs=GRAPHDATADEFAULT
               rolename=(q=eval (
               PROBIT((NUMERATE(SORT(DROPMISSING(RESIDUAL))) -0.375)/(0.25
               + N(RESIDUAL)))) s=eval (SORT(DROPMISSING(RESIDUAL))))
               tip=(q s) tiplabel=(q="Quantile" s="Residual");
            lineparm slope=eval (STDDEV(RESIDUAL)) Y=eval (MEAN(RESIDUAL))
               X=0 / lineattrs=GRAPHREFERENCE extend=true;
         EndLayout;
      EndGraph;
   end;
run;
In the template, the default title of the Q-Q plot is specified by the ENTRYTITLE statement. The variable _DepLabel is a dynamic variable that provides the name of the dependent variable in the regression analysis. In this case, the name is y. In this template, the label for the axes are specified by the LABEL= suboption of the YAXISOPTS= option for the LAYOUT OVERLAY statement. In other templates, the axis labels come from the column labels of the X-axis and Y-axis columns of the data object. You can see these labels by specifying ODS OUTPUT with the plot data object and running PROC CONTENTS with the resulting SAS data set.
Suppose you want to change the default title to "Analysis of Residuals", and you want the Y-axis label to display the name of the dependent variable. First, replace the ENTRYTITLE statement with the following statement:
entrytitle "Analysis of Residuals";
Next, replace the LABEL= suboption with the following:
label=("Standardized Robust Residual for " _DEPLABEL)
You can use dynamic text variables such as _DepLabel in any text element.
You can then submit the modified template definition as you would any SAS program, for example, by selecting Submit from the Run menu. After submitting the PROC TEMPLATE statements, you should see the following message in the SAS log:
  NOTE: STATGRAPH 'Stat.Robustreg.Graphics.QQPlot' has been
    saved to: SASUSER.TEMPLAT
For more information about graph definitions and the graph template language, see the section Graph Templates.
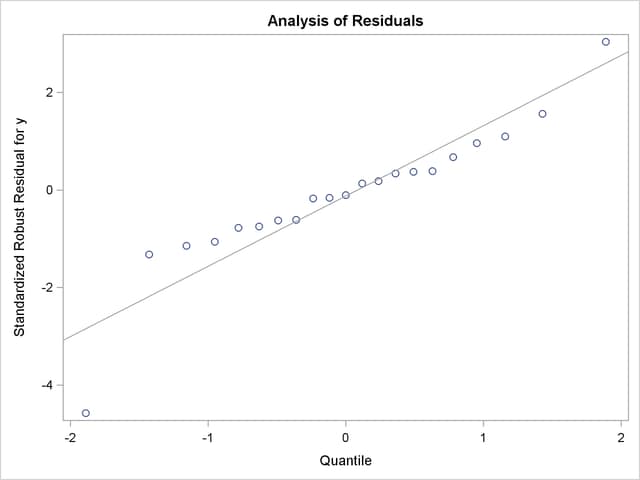
Finally, resubmit the PROC ROBUSTREG statements to display the Q-Q plot created with your modified template. The following statements create Output 21.5.4:
proc template;
   define statgraph Stat.Robustreg.Graphics.QQPlot;
      notes "Q-Q Plot for Standardized Robust Residuals";
      dynamic _DEPLABEL Residual;
      BeginGraph;
         entrytitle "Analysis of Residuals";
         layout Overlay /
            yaxisopts=(label=("Standardized Robust Residual for " _DEPLABEL))
            xaxisopts=(label="Quantile");
            SCATTERPLOT y=eval (SORT(DROPMISSING(RESIDUAL))) x=eval (
               PROBIT((NUMERATE(SORT(DROPMISSING(RESIDUAL))) -0.375)/(0.25
               + N(RESIDUAL)))) / primary=true markerattrs=GRAPHDATADEFAULT
               rolename=(q=eval (
               PROBIT((NUMERATE(SORT(DROPMISSING(RESIDUAL))) -0.375)/(0.25
               + N(RESIDUAL)))) s=eval (SORT(DROPMISSING(RESIDUAL))))
               tip=(q s) tiplabel=(q="Quantile" s="Residual");
            lineparm slope=eval (STDDEV(RESIDUAL)) Y=eval (MEAN(RESIDUAL))
               X=0 / lineattrs=GRAPHREFERENCE extend=true;
         EndLayout;
      EndGraph;
   end;
run;

proc robustreg data=stack plots=qqplot;
   ods select QQPlot;
   model y = x1 x2 x3;
run;
If you have not changed the default template search path, the modified template QQPlot is used automatically because SASUSER.Templat occurs before SASHELP.Tmplmst in the ODS search path. See the sections Saving Customized Templates, Using Customized Templates, and Reverting to the Default Templates for more information about the template search path and the ODS PATH statement.
You do not need to rerun the PROC ROBUSTREG analysis after you modify a graph template if you have stored the plot in an ODS document. After you modify your template, you can submit the PROC DOCUMENT statements in Example 21.4 to replay the Q-Q plot with the modified template. You can run the following statements to revert to the default template:
proc template;
   delete Stat.Robustreg.Graphics.QQPlot;
run;
Copyright © SAS Institute, Inc. All Rights Reserved.