| Using the Output Delivery System |
Example 20.8 HTML Output with Hyperlinks between Tables
This example demonstrates how you can use ODS to provide links between different parts of your HTML procedure output. In this example, a table is created where each row contains a link to another table with more information about that row.
Suppose that you are analyzing a  factorial experiment for an industrial process, testing for differences in the number of defective products manufactured by different machines, using different sources of raw material. The data set Experiment is created as follows:
title 'Product Defects Experiment';

data Experiment;
   do Supplier = 'A', 'B', 'C', 'D';
      do Machine = 1 to 4;
         do rep = 1 to 5;
            input Defects @@;
            output;
            end;
         end;
      end;
   datalines;
 2  6  3  3  6  8  6  6  4  4  4  2  4  0  4  5  5  7  8  5
13 12 12 11 12 16 15 14 14 13 11 10 12 12 10 13 13 14 15 12
 2  6  3  6  6  6  4  4  6  6  0  3  2  0  2  4  6  7  6  4
20 19 18 21 22 22 24 23 20 20 17 19 18 16 17 23 20 20 22 21
;
Suppose that you are interested in fitting a model to determine the effect that the supplier of raw material and machine type have on the number of defects in the products. If the F test for a factor is significant, you might like to follow up with a multiple-comparison test for the levels of that factor. The tables of interest are the model ANOVA and the multiple-comparison output. Since this is a balanced experiment, the ANOVA procedure computes the appropriate analysis. The following statements produce these tables and Figure 20.8.1:
ods listing close;
ods html body='anovab.htm' style=statistical anchor='anova1';
ods trace output;

proc anova data=Experiment;
   ods select ModelANOVA MCLines;
   class Supplier Machine;
   model Defects = Supplier Machine;
   means Supplier Machine / tukey;
run; quit;

ods html close;
ods listing;
The LISTING destination is closed to avoid generating the output twice. ODS writes the HTML output to the file anovab.htm. The ANCHOR= option specifies anova1 as the root name for the HTML anchor tags. This means that within the HTML document, the URL for the first table will be anova1, the URL for the second table will be anova2, and so on.
| Product Defects Experiment |
| Source | DF | Anova SS | Mean Square | F Value | Pr > F |
|---|---|---|---|---|---|
| Supplier | 3 | 3441.637500 | 1147.212500 | 580.72 | <.0001 |
| Machine | 3 | 163.137500 | 54.379167 | 27.53 | <.0001 |
The ODS trace output (not shown) shows that PROC ANOVA uses the Stat.GLM.Tests template to format the ANOVA table. The following statements demonstrate how you can link a row of the ANOVA table to the corresponding multiple-comparison table by modifying the table template, using the original values and the URLs for the second and third tables (anova2 and anova3):
proc template;
   edit Stat.GLM.Tests;
      edit Source;
         cellstyle _val_ = 'Supplier' as {url="#ANOVA2"},
                   _val_ = 'Machine'  as {url="#ANOVA3"};
      end;
   end;
run;
This template alters the values in the Source column ('Supplier' and 'Machine') of the ANOVA tests table by using the CELLSTYLE statement. The values of 'Supplier' and 'Machine' are displayed as hyperlinks in the HTML, and clicking them takes you to the links anova2 and anova3, which are the multiple-comparison tables.
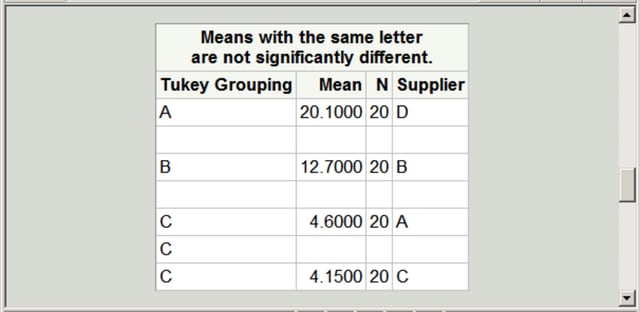
You can see the value to use in the URL by viewing the HTML source file, anovab.htm. You can either open the HTML file in a text editor or view it in a browser window and select View  Source. Search for '<a name=' to find the URL names. The first table is anova1, the second is anova2, the third is anova3, and so on. If the ANCHOR= option had not been used in the ODS HTML statement, the names would have been IDX, IDX1, IDX2, and so on. Note that if you do not use the ODS SELECT statement, or if you do anything to change the tables that come out, the names will be different. The statements create the Supplier label as a link that enables you to open the table of means from the "Tukey’s Studentized Range Test for Defects" associated with the Supplier variable. Similarly, Machine provides a link to the table of means from the "Tukey’s Studentized Range Test for Defects" associated with the Machine variable.
Next, the analysis is run again, this time by using the modified template. The following statements produce the results:
ods listing close;
ods html body='anovab.htm' style=statistical anchor='anova1';

proc anova data=Experiment;
   ods select ModelANOVA MCLines;
   class Supplier Machine;
   model Defects = Supplier Machine;
   means Supplier Machine / tukey;
run; quit;

ods html close;
ods listing;
The ANOVA table is displayed in Output 20.8.2.
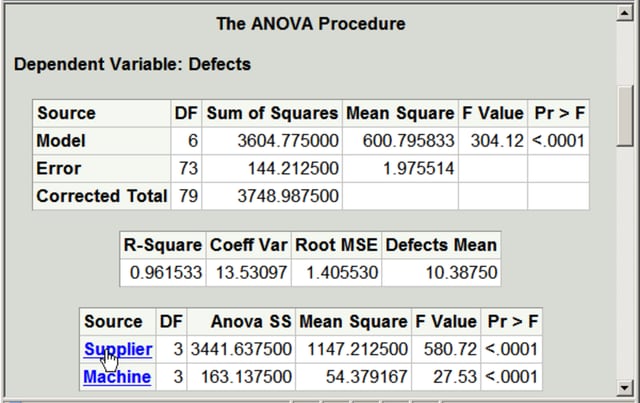
The underlined text displayed in Output 20.8.2 shows the links, Supplier and Machine, that you created with the modified template. When you click a link, the appropriate multiple-comparison table opens in your browser. Output 20.8.3 shows the table from the Supplier link.
When you run the PROC TEMPLATE step shown previously, the following note is printed in the SAS log:
NOTE: TABLE 'Stat.GLM.Tests' has been saved to: SASUSER.TEMPLAT
You can see that there are now two versions of the template by running the following statements:
proc template;
   list Stat.GLM.Tests;
run;
These statements produce Output 20.8.4.
You can delete your custom template and restore the default template as follows:
proc template;
   delete Stat.GLM.Tests;
run;
The following note is printed in the SAS log:
NOTE: 'Stat.GLM.Tests' has been deleted from: SASUSER.TEMPLAT
Copyright © SAS Institute, Inc. All Rights Reserved.