| The MODECLUS Procedure |
Example 57.5 Using the TRACE Option When METHOD=6
To illustrate how the TRACE option can help you to understand the clustering process when METHOD=6 is specified, the following data set is created with 12 observations:
data test;
   input x @@;
   datalines;
1 2 3 4 5 7.5 9 11.5 13 14.5 15 16
;
The first five observations seem to be close to each other, and the last five observations seem to be close to each other. Observation 6 is separated from the first five observations with a (Euclidean) distance of 2.5, and the same distance separates observation 7 from the last five observations. Observations 6 and 7 differ by 1.5.
Suppose METHOD=6 with a radius of 2.5 is chosen for the cluster analysis. You can specify the TRACE option to understand how each observation is assigned.
The following statements produce Output 57.5.1 and Output 57.5.2:
/*-- METHOD=6 with TRACE and THRESHOLD=0.5 (default) --*/
title 'METHOD=6 with TRACE and THRESHOLD=0.5 (default)';

proc modeclus data=test method=6 r=2.5 trace short out=out;
   var x;
run;

title2 'Plot of DENSITY*X=CLUSTER';

proc sgplot data=out;
   scatter y=density x=x / group=cluster datalabel=_obs_;
run;
| METHOD=6 with TRACE and THRESHOLD=0.5 (default) |
| Trace of Clustering Algorithm | ||||
|---|---|---|---|---|
| Obs | Density | Cluster | Ratio | |
| Old | New | |||
| 3 | 0.0833333 | -1 | 1 | M |
| 2 | 0.0666667 | 0 | 1 | N |
| 4 | 0.0666667 | 0 | 1 | N |
| 5 | 0.0666667 | 0 | 1 | N |
| 1 | 0.0500000 | 0 | 1 | N |
| 6 | 0.0500000 | 0 | 1 | 0.571 |
| 7 | 0.0500000 | -1 | 1 | 0.500 |
| 9 | 0.0666667 | -1 | 2 | M |
| 8 | 0.0500000 | 0 | 2 | N |
| 10 | 0.0666667 | -1 | 2 | S |
| 12 | 0.0500000 | 0 | 2 | N |
| 11 | 0.0666667 | -1 | 2 | S |
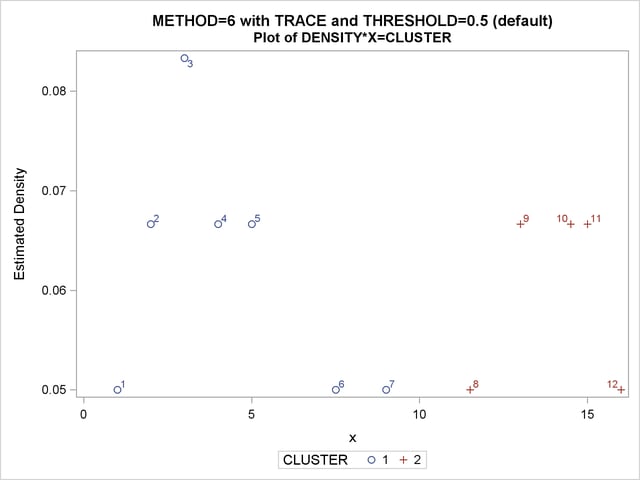
Note that in Output 57.5.1, observation 7 is originally a seed (indicated by a value of –1 in the "Old" column) and then assigned to cluster 1. This is because the ratio of observation 7 to cluster 1 is 0.5 and is not less than the default value of the THRESHOLD= option (0.5).
If the value of the THRESHOLD= option is increased to 0.55, observation 7 should be excluded from cluster 1 and the cluster membership of observation 7 is changed.
The following statements produce Output 57.5.3 and Output 57.5.4:
/*-- METHOD=6 with TRACE and THRESHOLD=0.55 --*/
title 'METHOD=6 with TRACE and THRESHOLD=0.55';

proc modeclus data=test method=6 r=2.5 trace threshold=0.55 short out=out;
   var x;
run;

title2 'Plot of DENSITY*X=CLUSTER with TRACE and THRESHOLD=0.55';

proc sgplot data=out;
   scatter y=density x=x / group=cluster datalabel=_obs_;
run;
| METHOD=6 with TRACE and THRESHOLD=0.55 |
| Trace of Clustering Algorithm | ||||
|---|---|---|---|---|
| Obs | Density | Cluster | Ratio | |
| Old | New | |||
| 3 | 0.0833333 | -1 | 1 | M |
| 2 | 0.0666667 | 0 | 1 | N |
| 4 | 0.0666667 | 0 | 1 | N |
| 5 | 0.0666667 | 0 | 1 | N |
| 1 | 0.0500000 | 0 | 1 | N |
| 6 | 0.0500000 | 0 | 1 | 0.571 |
| 9 | 0.0666667 | -1 | 2 | M |
| 8 | 0.0500000 | 0 | 2 | N |
| 10 | 0.0666667 | -1 | 2 | S |
| 12 | 0.0500000 | 0 | 2 | N |
| 11 | 0.0666667 | -1 | 2 | S |
| 7 | 0.0500000 | -1 | 2 | S |
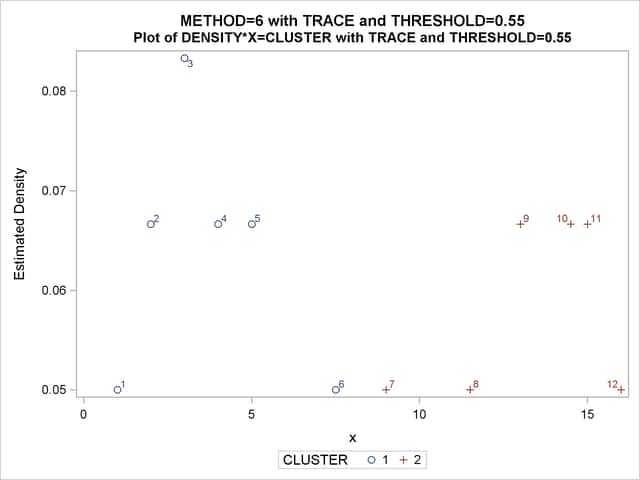
In Output 57.5.3, observation 7 is a seed that is excluded by cluster 1 because its ratio to cluster 1 is less than 0.55. Being a neighbor of a member (observation 8) of cluster 2, observation 7 eventually joins cluster 2 even though it remains a "SEED." (See Step 2.2 in the section METHOD=6.)
Copyright © SAS Institute, Inc. All Rights Reserved.