| The MCMC Procedure |
| Regenerating Diagnostics Plots |
By default, PROC MCMC generates three plots: the trace plot, the autocorrelation plot and the kernel density plot. Unless you had requested the display of ODS Graphics (ODS GRAPHICS ON) before calling the procedure, it is hard to generate the same graph afterwards. Directly using the template (Stat.MCMC.Graphics.TraceAutocorrDensity) is not feasible. To regenerate the same graph with a Markov chain, you need to define a template and use PROC SGRENDER to create the graph. See the SGRENDER procedure in the SAS/GRAPH: Statistical Graphics Procedures Guide. The following PROC TEMPLATE (see Chapter 21, Statistical Graphics Using ODS ) statements define a new graph template mygraphs.mcmc:
proc template;
   define statgraph mygraphs.mcmc;
   dynamic _sim _parm;
   BeginGraph;
      layout gridded /rows=2 columns=1 rowgutter=5;
         seriesplot x=_sim y=_parm;
         layout gridded /rows=1 columns=2 columngutter=15;
            layout overlay /
               yaxisopts=(linearopts=(viewmin=-1 viewmax=1
                                      tickvaluelist=(-1 -0.5 0 0.5 1))
                          label="Autocorrelation")
               xaxisopts=(linearopts=(integer=true)
                          label="Lag" offsetmin=.015);
               needleplot x=eval(lags(_parm,Max=50))
                          y=eval(acf(_parm, NLags=50));
            endlayout;

            layout overlay / xaxisopts=(label=_parm)
                             yaxisopts=(label="Density");
               densityplot _parm /kernel();
            endlayout;
         endlayout;
      endlayout;
   EndGraph;
end;
The DEFINE STATGRAPH statement tells PROC TEMPLATE that you are defining a new graph template (instead of a table or style template). The template is named mygraphs.mcmc. There are two dynamic variables: _sim and _parm. The variable _sim is the iteration number and the variable _parm is the variable in the data set that stores the posterior sample. All STATGRAPH template definitions must start with a BEGINGRAPH statement and conclude with a ENDGRAPH statement. The first LAYOUT GRIDDED statement assembles the results of nested STATGRAPH statements into a grid, with two rows and 1 column. The trace plot (SERIESPLOT) is shown in the first row of the graph. The second LAYOUT GRIDDED statement divides the second row of the graph into two graphs: one an autocorrelation plot (NEEDLEPLOT) and the other a kernel density plot (DENSITYPLOT). For details of other controls, such as the labels, line types, see Chapter 21, Statistical Graphics Using ODS.
A simple regression example, with three parameters, is used here. For an explanation of the regression model and the data involved, see Simple Linear Regression. The following statements generate a SAS data set and fit a regression model:
title 'Simple Linear Regression';

data Class;
   input Name $ Height Weight @@;
   datalines;
Alfred  69.0 112.5   Alice  56.5  84.0   Barbara 65.3  98.0
Carol   62.8 102.5   Henry  63.5 102.5   James   57.3  83.0
Jane    59.8  84.5   Janet  62.5 112.5   Jeffrey 62.5  84.0
John    59.0  99.5   Joyce  51.3  50.5   Judy    64.3  90.0
Louise  56.3  77.0   Mary   66.5 112.0   Philip  72.0 150.0
Robert  64.8 128.0   Ronald 67.0 133.0   Thomas  57.5  85.0
William 66.5 112.0
;
proc mcmc data=class nmc=50000 thin=5 outpost=classout seed=246810;
   ods select none;
   parms beta0 0 beta1 0;
   parms sigma2 1;
   prior beta0 beta1 ~ normal(0, var = 1e6);
   prior sigma2 ~ igamma(3/10, scale = 10/3);
   mu = beta0 + beta1*height;
   model weight ~ normal(mu, var = sigma2);
run;
ods select all;
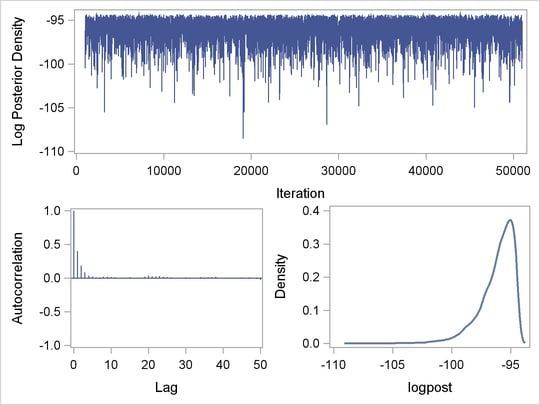
The output data set classout contains iteration number (Iteration) and posterior draws for beta0, beta1, and sigma2. It also stores the log of the prior density (LogPrior), log of the likelihood (LogLike), and the log of the posterior density (LogPost). If you want to examine the LogPost variable, you can use the following statements to generate the graphs:
proc sgrender data=classout template=mygraphs.mcmc;
   dynamic _sim='iteration' _parm='logpost';
run;
The SGRENDER procedure takes the classout data set and applies the template MYGRAPHS.MCMC that was defined previously. The DYNAMIC statement needs two arguments, iteration and logpost. The resulting graph is shown in Output 52.11.
Copyright © SAS Institute, Inc. All Rights Reserved.