| Introduction to Power and Sample Size Analysis |
| Basic Graphs (POWER, GLMPOWER, Power and Sample Size Application) |
If you include a PLOT statement, the GLMPOWER and POWER procedures produce standard power curves, representing any multi-valued input parameters with varying line styles, symbols, colors, and/or panels. The Power and Sample Size application also has an option to produce power curves.
To display default power curves for the preceding PROC POWER call, simply add the PLOT statement with no arguments as follows:
proc power plotonly;
   twosamplemeans test=diff
      meandiff = 5 6
      stddev = 12 18
      alpha = 0.05 0.1
      ntotal = 100 200
      power = .;
   plot;
run;
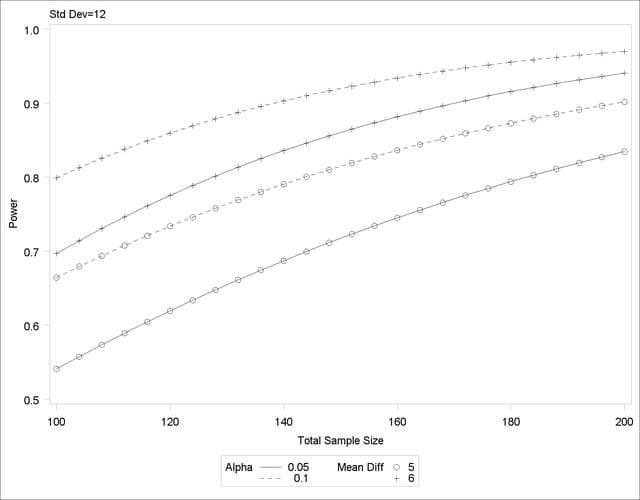
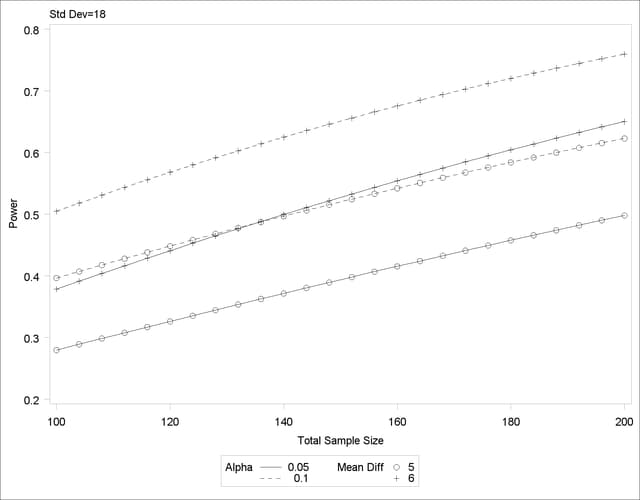
Figure 18.2 shows the results. Note that the line style varies by the significance level  , the symbol varies by the mean difference, and the panel varies by standard deviation.
Figure 18.2
PROC POWER Default Graphical Output
Copyright © SAS Institute, Inc. All Rights Reserved.