| The BOXPLOT Procedure |
Example 24.1 Displaying Summary Statistics in a Box Plot
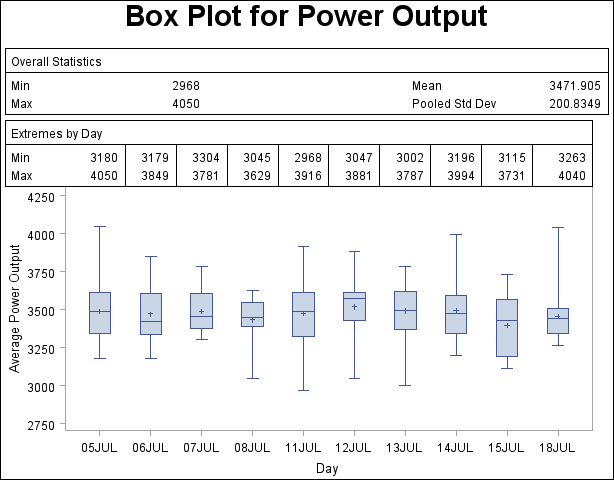
This example demonstrates how you can use the INSET and INSETGROUP statements to include tables of summary statistics in your box plots. The following statements produce a box plot of the Turbine data set from the section Getting Started: BOXPLOT Procedure, augmented with insets containing summary statistics:
title 'Box Plot for Power Output';
proc boxplot data=Turbine;
   plot KWatts*Day;
   inset min mean max stddev /
      header = 'Overall Statistics'
      pos    = tm;
   insetgroup min max /
      header = 'Extremes by Day';
run;
The INSET statement produces an inset of overall summary statistics. The keywords listed before the slash (/) request the minimum, mean, maximum, and standard deviation computed over all days. The POS=TM option places the inset in the top margin of the plot.
The INSETGROUP statement produces an inset containing statistics calculated for each group separately. The MIN and MAX keywords request the minimum and maximum observations from each day, respectively.
The resulting plot is shown in Output 24.1.1.
Copyright © SAS Institute, Inc. All Rights Reserved.