| The BOXPLOT Procedure |
| Continuous Group Variables |
By default, the PLOT statement treats numerical group variable values as discrete values and spaces the boxes evenly on the plot. The following statements produce the box plot in Figure 24.9:
title 'Box Plot for Power Output';
proc boxplot data=Turbine;
   plot KWatts*Day;
run;
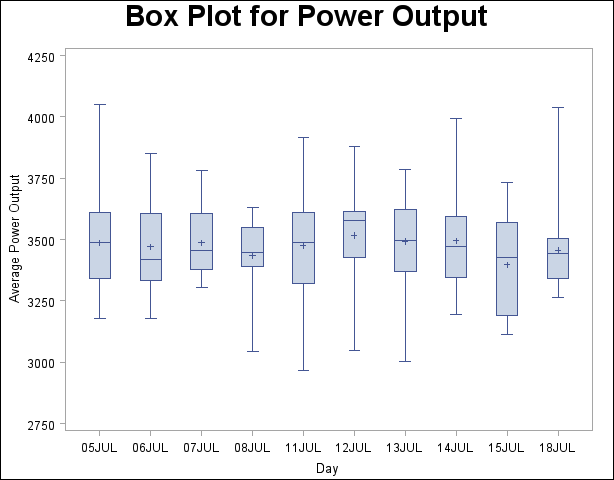
The labels on the horizontal axis in Figure 24.9 do not represent 10 consecutive days, but the box-and-whiskers plots are evenly spaced.
In order to treat the group variable as continuous, you can specify the CONTINUOUS or HAXIS= option when producing traditional graphics. Either option produces a box plot with a horizontal axis scaled for continuous group variable values. (ODS Graphics does not support a continuous group axis.)
The following statements produce the plot shown in Figure 24.10. The TURNHLABEL option orients the horizontal axis labels vertically so there is room to display them all.
title 'Box Plot for Power Output';
proc boxplot data=Turbine;
   plot KWatts*Day / turnhlabel
                     continuous;
run;
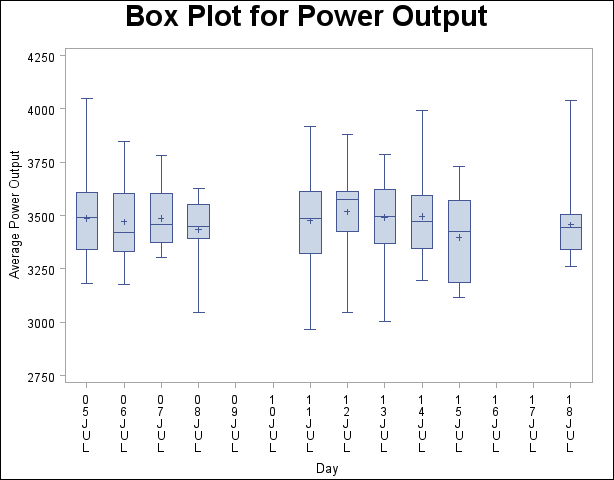
Note that the tick values on the horizontal axis represent consecutive days and that no box-and-whiskers plots are displayed for days when no turbine data were collected.
Copyright © SAS Institute, Inc. All Rights Reserved.