| The SEQDESIGN Procedure |
| Unified Family Methods |
Unified family methods (Kittelson and Emerson 1999) derive boundary values with a specified boundary shape. For example, Pocock’s method (Pocock 1977) derives equal boundary values for all stages in the standardized  scale. In addition to Pocock’s method, the unified family methods include the O’Brien-Fleming, power family, and unified family triangular methods.
The boundary values at each stage depend on the information fractions
 |
where  is the information available at stage
  and
and  is the maximum information, the information available at the end of the trial if the trial does not stop early.
Boundary Values in Standardized  Scale
Scale
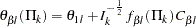
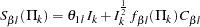
With the unified family method, the boundary values for the upper  boundary
  , upper
  boundary
  , lower boundary
  , and lower boundary
  , using the standardized normal scale, are given by the following:


where  and
and  are the lower and upper alternative references,
  ,
,  ,
,  , and
, and  are the specified shape functions, and
  ,
,  ,
,  , and
, and  are the critical values derived to achieve the specified and levels.
If a derived lower boundary value  is greater than its corresponding upper boundary value
  , then both values are set to missing.
Note that the drift parameters  and
and  are derived in the SEQDESIGN procedure. The boundary values in standardized Z scale can be derived without specifying the maximum information and alternative reference.
Shape Parameters
The shape function in the SEQDESIGN procedure is given by
 |
where the parameters  and
and  . can be specified for each boundary separately.
The parameters  and
and  determine the shape of the boundaries. Special cases of the unified family methods also include power family methods and triangular methods. Table 77.6 summarizes the corresponding parameter values in the unified family for these methods.
Method |
Option |
Unified Family |
|
Rho |
Tau |
||
Pocock |
POC |
0 |
0 |
O’Brien-Fleming |
OBF |
0.5 |
0 |
Power family |
POW (RHO= |
|
0 |
Triangular |
TRI (TAU= |
0.5 |
|
Note that the power parameter  , where
  is the power parameter used in Jennison and Turnbull (2000) and Wang and Tsiatis (1987) and
  is the power parameter used in Kittelson and Emerson (1999).
Also note that instead of the three parameters used in the unified family methods by Kittelson and Emerson (1999), only two parameters are used in the SEQDESIGN procedure. The other parameter is fixed at zero.
Boundary Values in MLE Scale
If the maximum information is available, the boundary values derived from a unified family method can also be displayed in the MLE scale:


These MLE scale boundary values are computed by multiplying  by the standardized scale boundary values at stage .
Boundary Values in Score Scale
If the maximum information is available, the boundary values derived from a unified family method can also be displayed in the score scale:


These MLE scale boundary values are computed by multiplying  by the standardized scale boundary values at stage .
Boundary Values in  -Value Scale
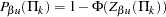
For a design with a lower alternative or a two-sided alternative, the  -value scale boundary values are the cumulative normal distribution function values of the standardized boundary values:


These nominal -values are the one-sided fixed-sample -values under the null hypothesis with a lower alternative.
For a one-sided design with an upper alternative, the -value scale boundary values are the one-sided fixed-sample -values under the null hypothesis with an upper alternative:

Pocock’s Method
The shape function for Pocock’s method (Pocock 1977) is given by
 |
The resulting boundary values for a two-sided design with an early stopping to reject the null hypothesis  are as follows:


That is, the rejection boundary values are constant over all stages of different information levels in the standardized scale.
Note that compared with other designs, Pocock’s design tends to stop the trials early with a larger -value. For a new treatment, Pocock’s design to stop a trial early with a large -value might not be persuasive enough to make a new treatment widely accepted (Pocock and White 1999). A Pocock design is illustrated in Example 77.3.
O’Brien-Fleming Method
The shape function for the O’Brien-Fleming method (O’Brien and Fleming 1979) is given by
 |
The resulting boundary values for a two-sided design with early stopping to reject the null hypothesis are as follows:


That is, the rejection boundaries are inversely proportional to the square root of the information levels in the standardized scale.
In the score scale, these boundaries can be displayed as follows:


which are constants over all stages in the score scale. An O’Brien-Fleming design is illustrated in Example 77.2.
Power Family Method
The shape function for a power family method (Wang and Tsiatis 1987; Emerson and Fleming 1989; Pampallona and Tsiatis 1994) is given by
 |
The resulting boundary values for a two-sided design with early stopping to reject the null hypothesis are as follows:


The rejection boundaries depend on the power parameter . The power family includes the Pocock and O’Brien-Fleming methods, and the power parameter is used to allow continuous movement between these two methods. A power family design is illustrated in Example 77.5.
Triangular Method
The shape function for a triangular method (Kittelson and Emerson 1999) in the unified family is given by
 |
The resulting boundary values for a two-sided design with early stopping to reject the null hypothesis are as follows:


In the score scale, these boundaries are as follows:


Thus, in the score scale, the boundary function is a linear function of the information . With these straight-line boundaries, a triangular method for a one-sided trial with early stopping to reject or accept the null hypothesis produces a triangular continuation region. Similarly, for a two-sided design, the continuation region is a union of two separate triangular regions. A triangular method is illustrated in Example 77.6.
Copyright © 2009 by SAS Institute Inc., Cary, NC, USA. All rights reserved.