| Statistical Graphics Using ODS |
| Default Plots for Simple Linear Regression with PROC REG |
This example is taken from the section Getting Started: REG Procedure of Chapter 73, The REG Procedure. It uses the following data from a study of 19 children:
   data Class;
      input Name $ Height Weight Age @@;
      datalines;
   Alfred  69.0 112.5 14  Alice  56.5  84.0 13  Barbara 65.3  98.0 13

   ... more lines ...

   ;
A larger version of this data set is available in the SASHELP library, and later examples use this data set by specifying data=sashelp.class.
The following statements use PROC REG to fit a simple linear regression model in which Weight is the response variable and Height is the independent variable:
   ods graphics on;

   proc reg data=Class;
      model Weight = Height;
   run; quit;
The ODS GRAPHICS ON statement is specified to request ODS Graphics in addition to the usual tabular output. The statement ODS GRAPHICS OFF is not used here, but it can be specified to disable ODS Graphics.
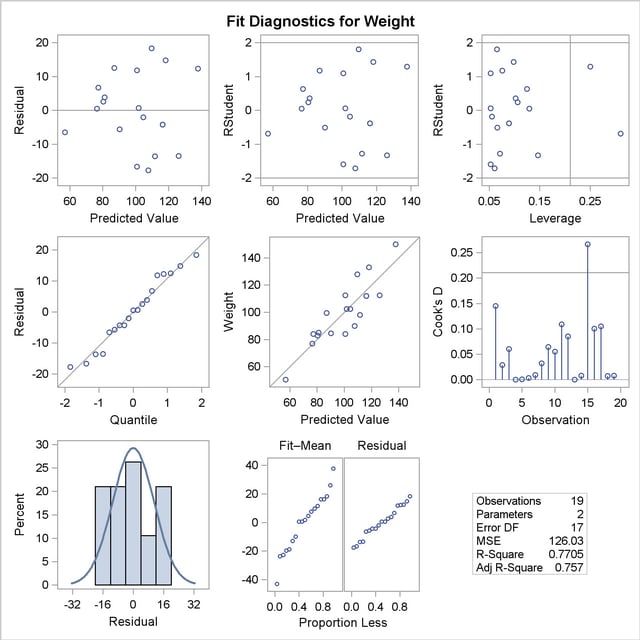
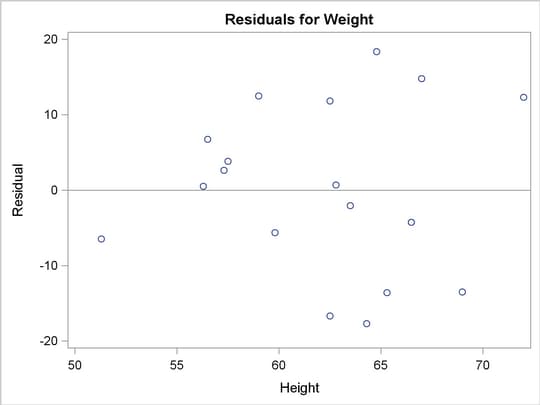
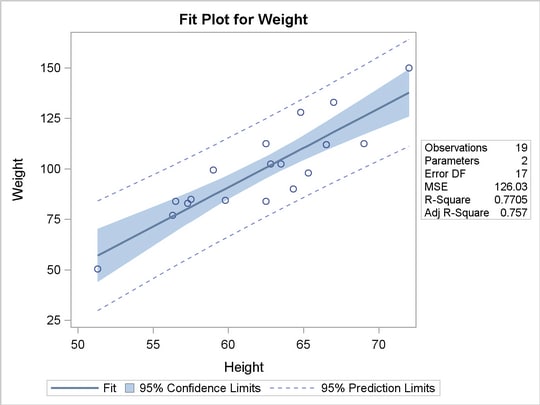
The graphical output consists of a fit diagnostics panel, a residual plot, and a fit plot. These plots are integrated with the tabular output and are shown in Figure 21.1, Figure 21.2, and Figure 21.3, respectively. The results are displayed in the STATISTICAL style.
ODS styles control the colors and general appearance of all graphs and tables, and SAS provides several styles that are recommended for use with statistical graphics. The STATISTICAL style is the default style in SAS/STAT documentation and is used unless another style is explicitly specified. The default style that you see when you run SAS depends on the ODS destination. Specifically, the default style for the LISTING destination is LISTING, the default style for the HTML destination is DEFAULT, and the default style for the RTF destination is RTF. These and other styles are shown in this chapter. For more information about styles, see the section Graph Styles and the section Styles.
Copyright © 2009 by SAS Institute Inc., Cary, NC, USA. All rights reserved.