| Statistical Graphics Using ODS |
Modifying the Plot Title
The template source listing is lengthy, but to change the title, you only need to find and modify the ENTRYTITLE statements. Many templates have conditional logic (IF statements, for example) and multiple overlays, so it is important that you find all of the relevant ENTRYTITLE statements.
The following abridged version of the statements show how you redefine the template:
proc template;
define statgraph Stat.Lifetest.Graphics.ProductLimitSurvival;
dynamic . . .;
BeginGraph;
if (NSTRATA=1)
if (EXISTS(STRATUMID))
entrytitle "Kaplan-Meier Plot for " STRATUMID;
else
entrytitle "Kaplan-Meier Plot";
endif;
if (PLOTATRISK)
entrytitle "with Number of Subjects at Risk" / textattrs=
GRAPHVALUETEXT;
endif;
layout overlay / xaxisopts=(shortlabel=XNAME offsetmin=.05
linearopts=(viewmax=MAXTIME)) yaxisopts=(label=
"Survival Probability" shortlabel="Survival" linearopts=(
viewmin=0 viewmax=1 tickvaluelist=(0 .2 .4 .6 .8 1.0)));
. . .
endlayout;
else
entrytitle "Kaplan-Meier Plot";
if (EXISTS(SECONDTITLE))
entrytitle SECONDTITLE / textattrs=GRAPHVALUETEXT;
endif;
layout overlay / xaxisopts=(shortlabel=XNAME offsetmin=.05
linearopts=(viewmax=MAXTIME)) yaxisopts=(label=
"Survival Probability" shortlabel="Survival" linearopts=(
viewmin=0 viewmax=1 tickvaluelist=(0 .2 .4 .6 .8 1.0)));
. . .
endlayout;
endif;
EndGraph;
end;
run;
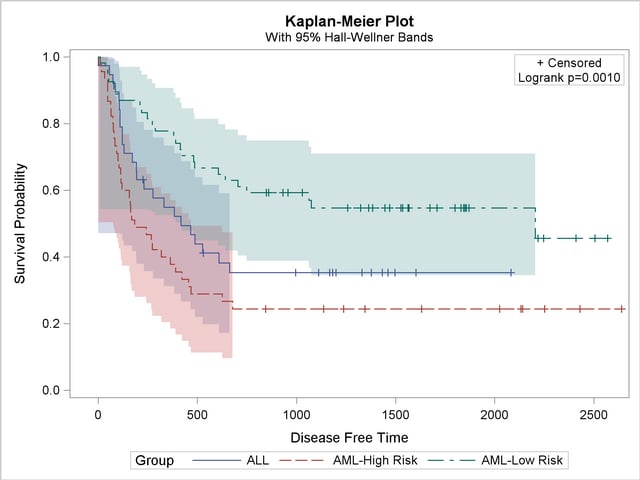
proc lifetest data=BMT plots=survival(cb=hw test);
time T * Status(0);
strata Group / test=logrank;
run;
The preceding steps create Output 21.6.1.
Output 21.6.1
Kaplan-Meier Plot
You can restore the default template by running the following step:
   proc template;
      delete Stat.Lifetest.Graphics.ProductLimitSurvival;
   run;
Copyright © 2009 by SAS Institute Inc., Cary, NC, USA. All rights reserved.