| Statistical Graphics Using ODS |
Modifying Colors, Line Styles, and Markers
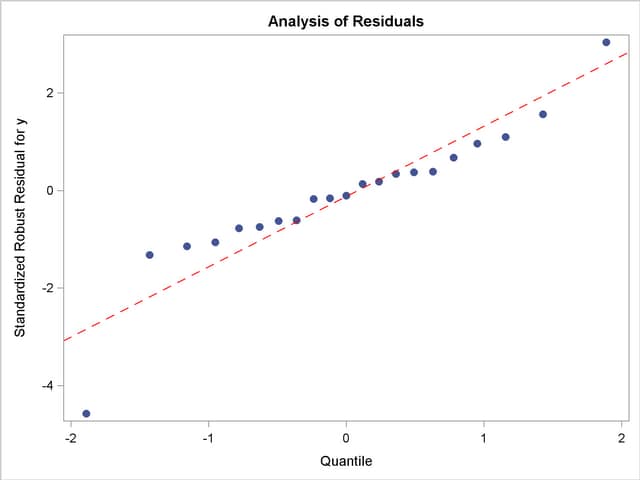
This section shows you how to customize colors, line attributes, and marker symbol attributes by modifying a graph template. In the QQPlot template definition shown in Output 21.5.3, the SCATTERPLOT statement specifies a scatter plot of normal quantiles versus ordered standardized residuals. The attributes of the marker symbol in the scatter plot are specified by: MarkerAttrs=GraphDataDefault. This is a reference to the style element GraphDataDefault. See the section Style Elements and Attributes for more information.
The actual value of the marker symbol depends on the style that you are using. In this case, since the STATISTICAL style is used, the marker symbol is a circle. You can specify a filled circle as the marker symbol by overriding the symbol portion of the style specification as follows: MarkerAttrs=GraphDataDefault(symbol=CircleFilled).
The value of the SYMBOL= option can be any valid marker symbol or a reference to a style attribute of the form style-element:attribute. It is recommended that you use style attributes because they are chosen to provide consistency and appropriate emphasis based on display principles for statistical graphics. If you specify values directly in a template, you are overriding the style and you run the risk of creating a graph that is inconsistent with the style definition. For more information about the syntax of the Graph Template Language and style elements for graphics, see the SAS/GRAPH Template Language Reference and the SAS Output Delivery System: User's Guide.
Similarly, you can change the line color and pattern with the LINEATTRS= option in the LINEPARM statement. The LINEPARM statement displays a straight line specified by slope and intercept parameters. The following option changes the color of the line to red and the line pattern to dashed, by overriding those aspects of the style specification: LineAttrs=GraphReference(color=red pattern=dash). To see the results, submit the modified template definition and the PROC ROBUSTREG statements as follows to create Output 21.5.5:
   proc template;
      define statgraph Stat.Robustreg.Graphics.QQPlot;
         notes "Q-Q Plot for Standardized Robust Residuals";
         dynamic _DEPLABEL Residual;
         BeginGraph;
            entrytitle "Analysis of Residuals";
            layout Overlay /
               yaxisopts=(label=("Standardized Robust Residual for " _DEPLABEL))
               xaxisopts=(label="Quantile");
               SCATTERPLOT y=eval (SORT(DROPMISSING(RESIDUAL))) x=eval(
                  PROBIT((NUMERATE(SORT(DROPMISSING(RESIDUAL))) -0.375)/(0.25
                  + N(RESIDUAL)))) / primary=true
                  markerattrs=GraphDataDefault(symbol=CircleFilled)
                  rolename=(q=eval (
                  PROBIT((NUMERATE(SORT(DROPMISSING(RESIDUAL))) -0.375)/(0.25
                  + N(RESIDUAL)))) s=eval (SORT(DROPMISSING(RESIDUAL))))
                  tip=(q s) tiplabel=(q="Quantile" s="Residual");
               lineparm slope=eval (STDDEV(RESIDUAL)) Y=eval (MEAN(RESIDUAL))
                  X=0 / lineattrs=GraphReference(color=red pattern=dash)
                        extend=true;
            EndLayout;
         EndGraph;
      end;
   run;

   ods graphics on;

   proc robustreg data=stack plots=qqplot;
      ods select QQPlot;
      model y = x1 x2 x3;
   run;
Alternatively, you can replay the plot with PROC DOCUMENT, as in Example 21.4.
Copyright © 2009 by SAS Institute Inc., Cary, NC, USA. All rights reserved.