| Using the Output Delivery System |
Example 20.1 Creating HTML Output with ODS
This example demonstrates how you can use the ODS HTML statement to display your output in HTML. The following statements create the data set Scores, which contains the golf scores of boys and girls in a physical education class:
   title 'Comparing Group Means';

   data Scores;
      input Gender $ Score @@;
      datalines;
   f 75  f 76  f 80  f 77  f 80  f 77  f 73
   m 82  m 80  m 85  m 85  m 78  m 87  m 82
   ;
The TTEST procedure is used to compare the scores. The ODS HTML statement specifies the name of the file to contain the HTML output. The following statements create the HTML file ttest.htm:
   ods html body='ttest.htm' style=statistical;

   proc ttest;
      class Gender;
      var Score;
   run;

   ods html close;
By default, the LISTING destination receives all output generated during your SAS session. In this example, the ODS HTML statement opens the HTML destination as well, and both destinations receive the generated output. Note that you must specify the following statement before you can view your output in a browser:
ods html close;
If you do not close the HTML destination, your HTML file might contain no output or incomplete output, or you might experience other unexpected results.
The following statements use ODS to display the output in HTML with a table of contents by using the STATISTICAL style of output, but this time closing the LISTING destination:
   ods listing close;
   ods html body='ttest.htm' contents='ttestc.htm' frame='ttestf.htm'
            style=statistical;

   proc ttest;
      class Gender;
      var Score;
   run;

   ods html close;
   ods listing;
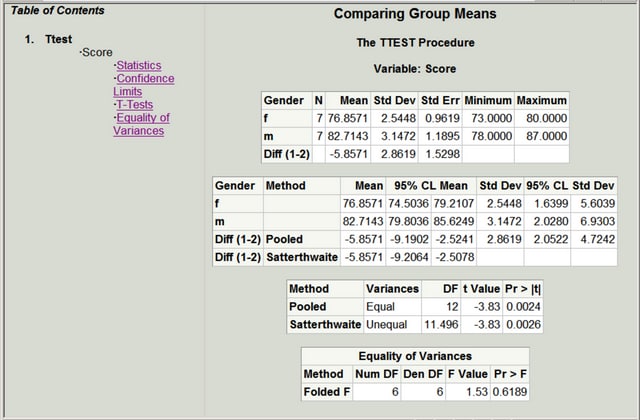
The ODS HTML statement specifies three files. The BODY= option specifies the file that contains the SAS output. The CONTENTS= option specifies the file that contains the table of contents. The FRAME= option specifies the file that displays both the table of contents and the output. You can open the FRAME= file (ttestf.htm) in your browser to view the table of contents together with the generated output (see Output 20.1.1). By default, the HTML files are generated in your current working directory. You can instead specify paths, such as frame=’html/ttestf.htm’, to put a file in a subdirectory.
Note that if you specify the ODS HTML statement with only the BODY= argument, no table of contents is created. The table of contents contains the descriptive label for each output table produced in the PROC TTEST step. You can select any label in the table of contents and the corresponding output will be displayed on the right side of the browser window.
You could enable ODS Graphics by adding an ODS GRAPHICS ON statement as follows:
   ods graphics on;
   ods listing close;
   ods html body='ttest.htm' contents='ttestc.htm' frame='ttestf.htm'
            style=statistical;

   proc ttest;
      class Gender;
      var Score;
   run;

   ods html close;
   ods listing;
   ods graphics off;
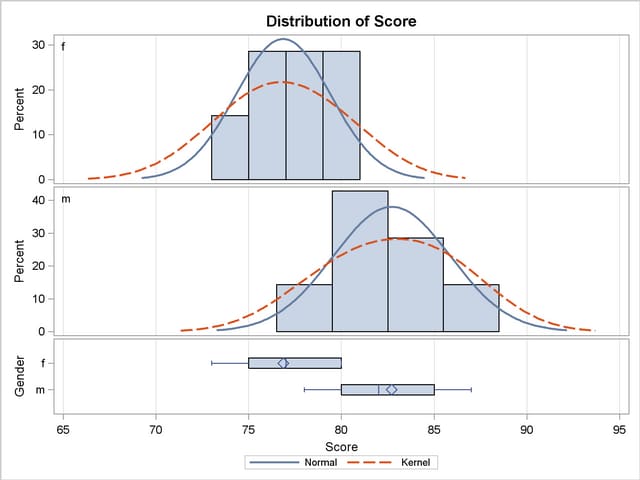
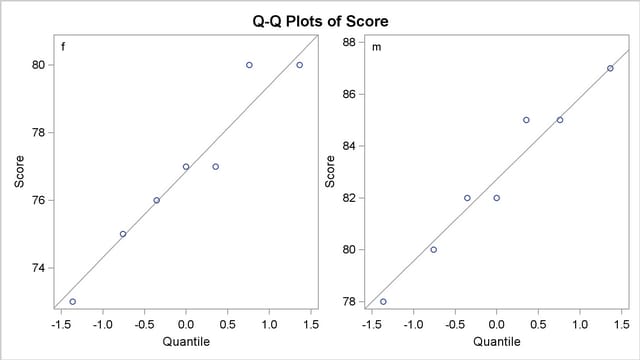
Then in addition to the tables, you would also get the graphs shown in Figure 20.1.2. For general information about ODS Graphics, see Chapter 21, Statistical Graphics Using ODS.
Copyright © 2009 by SAS Institute Inc., Cary, NC, USA. All rights reserved.