| The MIANALYZE Procedure |
Example 55.10 Combining Correlation Coefficients
This example combines sample correlation coefficients computed from a set of imputed data sets by using Fisher’s  transformation.
Fisher’s transformation of the sample correlation  is
is
 |
The statistic is approximately normally distributed with mean
 |
and variance  , where
  is the population correlation coefficient and
  is the number of observations.
The following statements use the CORR procedure to compute the correlation and its associated Fisher’s statistic between variables Oxygen and RunTime for each imputed data set. The ODS statement is used to save Fisher’s statistic in an output data set.
   proc corr data=outmi fisher(biasadj=no);
      var Oxygen RunTime;
      by _Imputation_;
      ods output FisherPearsonCorr= outz;
   run;
The following statements display the number of observations and Fisher’s statistic for each imputed data set in Output 55.10.1:
   proc print data=outz;
      title 'Fisher''s Correlation Statistics';
      var _Imputation_ NObs ZVal;
   run;
Statistics
The following statements generate the standard error associated with the statistic,  :
:
   data outz;
      set outz;
      StdZ= 1. / sqrt(NObs-3);
   run;
The following statements use the MIANALYZE procedure to generate a combined parameter estimate  and its variance, as shown in Output 55.10.2. The ODS statement is used to save the parameter estimates in an output data set.
   proc mianalyze data=outz;
      ods output ParameterEstimates=parms;
      modeleffects ZVal;
      stderr StdZ;
   run;
| Parameter Estimates | ||||||||||
|---|---|---|---|---|---|---|---|---|---|---|
| Parameter | Estimate | Std Error | 95% Confidence Limits | DF | Minimum | Maximum | Theta0 | t for H0: Parameter=Theta0 |
Pr > |t| | |
| ZVal | -1.331787 | 0.200327 | -1.72587 | -0.93771 | 330.23 | -1.401459 | -1.278686 | 0 | -6.65 | <.0001 |
In addition to the estimate for , PROC MIANALYZE also generates  confidence limits for ,
  and
and  . The following statements print the estimate and confidence limits for in Output 55.10.3:
   proc print data=parms;
      title 'Parameter Estimates with 95% Confidence Limits';
      var Estimate LCLMean UCLMean;
   run;
Confidence Limits
An estimate of the correlation coefficient with its corresponding confidence limits is then generated from the following inverse transformation as described in the section Correlation Coefficients:
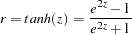 |
for  , , and .
The following statements generate and display an estimate of the correlation coefficient and its confidence limits, as shown in Output 55.10.4:
   data corr_ci;
      set parms;
      r=       tanh( Estimate);
      r_lower= tanh( LCLMean);
      r_upper= tanh( UCLMean);
   run;
   proc print data=corr_ci;
      title 'Estimated Correlation Coefficient'
            ' with 95% Confidence Limits';
      var r r_lower r_upper;
   run;
Copyright © 2009 by SAS Institute Inc., Cary, NC, USA. All rights reserved.