| The LIFETEST Procedure |
| PROC LIFETEST Statement |
The PROC LIFETEST statement invokes the procedure. Optionally, this statement identifies an input and an OUTSURV= data set, and specifies the computation details of the survivor function estimation. The options listed in Table 49.1 are available in the PROC LIFETEST statement and are described in alphabetic order. If no options are requested, PROC LIFETEST computes and displays the product-limit estimate of the survivor function; and if an ods graphics on statement is specified, a plot of the estimated survivor function is also displayed.
Option |
Description |
|---|---|
Input and Output Data Sets |
|
specifies the input SAS data set |
|
names an output data set to contain survival estimates and confidence limits |
|
names an output data set to contain rank test statistics for association of survival time with covariates |
|
Nonparametric Estimation |
|
specifies interval endpoints for life-table estimates |
|
adds the Nelson-Aalen estimates |
|
specifies the method to compute survivor function |
|
specifies the number of intervals for life-table estimates |
|
specifies the width of intervals for life-table estimates |
|
Confidence Limits for Survivorship |
|
sets the confidence level for interval estimation estimates |
|
specifies the maximum time for confidence band |
|
specifies the minimum time for confidence band |
|
specifies the type of confidence band in the OUTSURV= data set |
|
specifies the transformation applied to the survivor function to obtain confidence limits |
|
Line Printer Plots |
|
defines the characters used for line printer plot axes |
|
specifies that plots be produced by a line printer |
|
specifies the maximum time value for plotting |
|
suppresses the plot of censored observations |
|
specifies the plots to display |
|
ODS Graphics |
|
specifies the maximum time value for plotting |
|
specifies plots to display |
|
Traditional Graphics |
|
specifies an Annotate data set that adds features to plots |
|
defines the symbol used for censored observations in plots |
|
specifies the string that appears in the description field of the PROC GREPLAY master menu for the plots |
|
specifies the symbol used for event observations in plots |
|
specifies the graphics catalog name for saving graphics output |
|
specifies an input data set that contains variables for local annotation |
|
specifies the maximum time value for plotting |
|
specifies the plots to display |
|
Control Output |
|
suppresses the display of printed output |
|
suppresses the display of survival function estimates |
|
displays only the product-limit estimate for the smallest time within each specified interval |
|
specifies a list of time points at which the Kaplan-Meier estimates are displayed |
|
specifies that only INTERVAL= or TIMELIST= observations be listed in the OUTSURV= data set |
|
Miscellaneous |
|
sets the confidence level for survival time quartiles |
|
allows missing values to be a stratum level |
|
sets the tolerance for testing singularity of covariance matrix of rank statistics |
|
outputs the standard error for the survival estimators to the OUTSURV= data set |
|
specifies the time limit used to estimate the mean survival time and its standard error |
|
The PLOTS= option in the PROC LIFETEST statement specifies the plots to display. You can select one of the following three types of graphics in PROC LIFETEST: line printer, traditional, and ODS. If you specify the LINEPRINTER option, you get line printer plots; otherwise you get the traditional graphics if ODS Graphics is not enabled, and you get the ODS Graphics plots if the ods graphics on statement is specified. The following table depicts the behavior regarding the type of graphics produced:
ODS Graphics |
PROC LIFETEST Options |
Behavior |
|
OFF |
no graphics |
||
OFF |
LINEPRINTER |
no graphics |
|
OFF |
PLOTS=SURVIVAL |
traditional graphics |
|
OFF |
PLOTS=SURVIVAL |
LINEPRINTER |
line printer plot |
ON |
ODS Graphics survival plot |
||
ON |
LINEPRINTER |
no graphics |
|
ON |
PLOTS=SURVIVAL |
ODS Graphics |
|
ON |
PLOTS=SURVIVAL |
LINEPRINTER |
line printer plot |
ODS Graphics is now the preferred method of requesting graphics. Many new features have been added to the ODS Graphics plots in PROC LIFETEST. For example, you can display the number of subjects at risk in a survival plot through ODS Graphics, but such a feature is not available in traditional graphics or line printer plots. The PLOTS= option syntax is documented separately for each type of graphics and is preceded by a heading that indicates the graphics type.
-
ALPHA=

specifies the level of significance
for the  % confidence intervals for the survivor, hazard, and density functions. For example, the option ALPHA=0.05 requests the 95% confidence limits for the survivor function. The default value is 0.05.
 -
ALPHAQT=
specifies the significance level
for the % confidence intervals for the quartiles of the survival time. For example, the option ALPHAQT=0.05 requests a 95% confidence interval for the quartiles of the survival time. The default value is 0.05. - ANNOTATE=SAS-data-set
- ANNO=SAS-data-set
specifies an input data set that contains appropriate variables for annotation of the traditional graphics. The ANNOTATE= option enables you to add features (for example, labels explaining extreme observations) to plots produced on graphics devices. The ANNOTATE= option cannot be used if the LINEPRINTER option or the ods graphics on statement is specified. The data set specified must be an ANNOTATE= type data set, as described in SAS/GRAPH Software: Reference.
The data set specified with the ANNOTATE= option in the PROC LIFETEST statement is "global" in the sense that the information in this data set is displayed in every plot produced by a single invocation of PROC LIFETEST.
- BANDMAXTIME=value
- BANDMAX=value
specifies the maximum time for the confidence bands. The default is the largest observed event time. If the specified BANDMAX= time exceeds the largest observed event time, it is truncated to the largest observed event time.
- BANDMINTIME=value
- BANDMIN=value
specifies the minimum time for the confidence bands. The default is the smallest observed event time. For the equal-precision band, if the BANDMIN= value is less than the smallest observed event time, it is defaulted to the smallest observed event time.
- CENSOREDSYMBOL=name | ’string’
- CS=name | ’string’
specifies the symbol value for the censored observations in traditional graphics. The value, name or ’string’, is the symbol value specification allowed in SAS/GRAPH software. The default is CS=CIRCLE. If you want to omit plotting the censored observations, specify CS=NONE. The CENSOREDSYMBOL= option cannot be used if the LINEPRINTER option or the ods graphics on statement is specified.
- CONFBAND=keyword
specifies the confidence bands to be output to the OUTSURV= data set. Confidence bands are available only for the product-limit method. You can use the following keywords:
- CONFTYPE=keyword
specifies the transformation applied to
 to obtain the pointwise confidence intervals and the confidence bands for the survivor function as well as the confidence intervals for the quartiles of the survival times. The following keywords can be used and the default is CONFTYPE=LOGLOG.
 - ASINSQRT
the arcsine-square root transformation
- LOGLOG

This is also referred to as the log cumulative hazard transformation since it is applying the logarithmic function
 to the cumulative hazard function. Collett (1994) and Lachin (2000) refer it as the complementary log-log transformation.
 - LINEAR
the identity transformation

- LOG
the logarithmic transformation

- LOGIT
the logit transformation
- DATA=SAS-data-set
names the SAS data set used by PROC LIFETEST. By default, the most recently created SAS data set is used.
- DESCRIPTION=’string ’
- DES=’string ’
specifies a descriptive string of up to 256 characters that appears in the "Description" field of the traditional graphics catalog. The description does not appear in the plots. By default, PROC LIFETEST assigns a description of the form PLOT OF vname vs hname, where vname and hname are the names of the y variable and the x variable, respectively. The DESCRIPTION= option cannot be used if the LINEPRINTER option or the ods graphics on statement is specified.
- EVENTSYMBOL=name | ’string’
- ES=name | ’string’
specifies the symbol value for the event observations in traditional graphics. The value, name or ’string’, is the symbol value specification allowed in SAS/GRAPH software. The default is ES=NONE. The EVENTSYMBOL= option cannot be used if the LINEPRINTER option or the ods graphics on statement is specified.
- FORMCHAR(1,2,7,9)=’string’
defines the characters used for constructing the vertical and horizontal axes of the line printer plots. The string should be four characters. The first and second characters define the vertical and horizontal bars, respectively, which are also used in drawing the steps of the product-limit survival function. The third character defines the tick mark for the axes, and the fourth character defines the lower-left corner of the plot. If the FORMCHAR option in PROC LIFETEST is not specified, the value supplied, if any, with the system option FORMCHAR= is used. The default is FORMCHAR(1,2,7,9)=’|-+-’. Any character or hexadecimal string can be used to customize the plot appearance. To send the plot output to a printer with the IBM graphics character set (1 or 2) or display it directly on your PC screen, you can use the hexadecimal representation
formchar(1,2,7,9)='B3C4C5C0'x
or the system option
formchar='B3C4DACBFC3C5B4C0C1D9'x
Refer to the chapter titled "The PLOT Procedure" in the Base SAS Procedures Guide or the section "System Options" in SAS Language Reference: Dictionary for further information.
- GOUT=graphics-catalog
specifies the graphics catalog for saving traditional graphics output from PROC LIFETEST. The default is WORK.GSEG. The GOUT= option cannot be used if the LINEPRINTER option or the ods graphics on statement is specified. For more information, refer to the chapter titled "The GREPLAY Procedure" in SAS/GRAPH Software: Reference.
- INTERVALS=values
specifies a list of interval endpoints for the life-table method. These endpoints must all be nonnegative numbers. The initial interval is assumed to start at zero whether or not zero is specified in the list. Each interval contains its lower endpoint but does not contain its upper endpoint. When this option is used with the product-limit method, it reduces the number of survival estimates displayed by displaying only the estimates for the smallest time within each specified interval. The INTERVALS= option can be specified in any of the following ways:
list separated by blanks
intervals=1 3 5 7
list separated by commas
intervals=1,3,5,7
x to y
intervals=1 to 7
x to y by z
intervals=1 to 7 by 1
combination of the above
intervals=1,3 to 5,7
For example, the specification
intervals=5,10 to 30 by 10
produces the set of intervals

- LANNOTATE=SAS-data-set
- LANN=SAS-data-set
specifies an input data set that contains variables for local annotation of traditional graphics. You can use the LANNOTATE= option to specify a different annotation for each BY group, in which case the BY variables must be included in the LANNOTATE= data set. The LANNOTATE= option cannot be used if the LINEPRINTER option or the ods graphics on statement is specified. The data set specified must be an ANNOTATE= type data set, as described in SAS/GRAPH Software: Reference.
If there is no BY-group processing, the ANNOTATE= and LANNOTATE= options have the same effects.
- LINEPRINTER
- LS
specifies that plots are produced by a line printer instead of by a graphical device.
- MAXTIME=value
specifies the maximum value of the time variable allowed on the plots so that outlying points do not determine the scale of the time axis of the plots. This option affects only the displayed plots and has no effect on any calculations.
- METHOD=type
specifies the method used to compute the survival function estimates. Valid values for type are as follows:
- MISSING
allows missing values for numeric variables and blank values for character variables as valid stratum levels. See the section Missing Values for details.
By default, PROC LIFETEST does not use observations with missing values for any stratum variables.
- NELSON
- AALEN
produces the Nelson-Aalen estimates of the cumulative hazards and the corresponding standard errors. This option is ignored unless METHOD=PL.
- NINTERVAL=value
specifies the number of intervals used to compute the life-table estimates of the survivor function. This parameter is overridden by the WIDTH= option or the INTERVALS= option. When you specify the NINTERVAL= option, PROC LIFETEST tries to find an interval that results in round numbers for the endpoints. Consequently, the number of intervals can be different from the number requested. Use the INTERVALS= option to control the interval endpoints. The default is NINTERVAL=10.
- NOCENSPLOT
- NOCENS
requests that the plot of censored observations be suppressed when the LINEPRINTER and PLOTS= options are specified. This option is not needed when the life-table method is used to compute the survival estimates, since the plot of censored observations is not produced.
- NOPRINT
suppresses the display of output. This option is useful when only an output data set is needed. Note that this option temporarily disables the Output Delivery System (ODS); see Chapter 20, Using the Output Delivery System for more information.
- NOTABLE
suppresses the display of survival function estimates. Only the number of censored and event times, plots, and test results is displayed.
- OUTSURV=SAS-data-set
- OUTS=SAS-data-set
creates an output SAS data set to contain the estimates of the survival function and corresponding confidence limits for all strata. See the section OUTSURV= Data Set for more information about the contents of the OUTSURV= data set.
- OUTTEST=SAS-data-set
- OUTT=SAS-data-set
creates an output SAS data set to contain the overall chi-square test statistic for association with failure time for the variables in the TEST statement, the values of the univariate rank test statistics for each variable in the TEST statement, and the estimated covariance matrix of the univariate rank test statistics. See the section OUTTEST= Data Set for more information about the contents of the OUTTEST= data set.
- PLOTS=plot-request
- PLOTS=(plot-requests)
controls the line printer plots produced. You must also specify the LINEPRINTER option to obtain line printer plots. When you specify only one plot-request, you can omit the parentheses around the plot-request. Here are some examples:
    plots=s
    plots=(s ls lls)
The plot-requests include the following:
- CENSORED
- C
specifies a plot of censored observations (product-limit method only).
- SURVIVAL
- S
specifies a plot of the estimated SDF versus time.
- LOGSURV
- LS
specifies a plot of the
 versus time.
 - LOGLOGS
- LLS
specifies a plot of the
 versus
  .
. - HAZARD
- H
specifies a plot of the estimated hazard function versus time (life-table method only).
- P
specifies a plot of the estimated probability density function versus time (life-table method only).
ODS Graphics PLOTS= Option
- PLOTS<(global-plot-option)> = plot-request <(options)>
- PLOTS<(global-plot-option)> = (plot-request <(options)> <...plot-request <(options)> >)
controls the plots produced using ODS Graphics. When you specify only one plot-request, you can omit the parentheses around the plot-request. Here are some examples:
   plots=none
   plots=(survival(atrisk=100 to 350 by 50) logsurv)
   plots(only)=hazard
You must enable ODS Graphics before requesting plots—for example, like this:
   ods graphics on;

   proc lifetest plots=survival(atrisk);
      time T*Status(0);
   run;

   ods graphics off;
For general information about ODS Graphics, see Chapter 21, Statistical Graphics Using ODS. If you have enabled ODS Graphics but do not specify the PLOTS= option, then PROC LIFETEST produces a plot of the estimated survivor functions by default. The only global plot option follows:- ONLY
specifies that only the specified plots in the list be produced; otherwise, the default survivor function plot is also displayed.
The plot-requests and plot-request options include the following.
- ALL
produces all appropriate plots. For the product-limit method, specifying PLOTS=ALL is equivalent to specifying PLOTS=(SURVIVAL LOGSURV LOGLOGLS HAZARD); for the life-table method, it is the same as specifying PLOTS=(SURVIVAL LOGSURV LOGLOGS DENSITY HAZARD).
- HAZARD <(hazard-options)>
- H <hazard-options>
plots the estimated hazard functions. Kernel-smoothed estimates are produced for the product-limit method. The following hazard-options can be specified for the product-limit method, but only the CL option can be used for the life-table method.
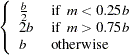
- BANDWIDTH=bandwidth-option
- BW=bandwidth-option
- specifies what bandwidth is chosen for the kernel-smoothing and how it is chosen. You can specify one of the following bandwidth-options.
- value
sets the bandwidth to the given value.
- numeric-list
selects the bandwidth from the given numeric-list that minimizes the mean integrated squared error.
- RANGE(lower,upper)
selects the bandwidth from the interval (lower, upper) that minimizes the mean integrated squared error. PROC LIFETEST uses the golden section search algorithm to find the minimum. If there is more than one local minimum in the interval, there is no guarantee that the local minimum found is also the global minimum.
 ,20), where
  ,
,  and
and  are the values of the GRIDL= and GRIDU= options, respectively, and
  is the total number of noncensored observations.
 - GRIDL=number
specifies the lower grid limit for the kernel-smoothed estimate. The default value is the time origin.
- GRIDU=number
specifies the upper grid limit for the kernel-smoothed estimate. The default value equals the maximum event time
- KERNEL=kernel-option
- specifies the kernel used. The choices are as follows:
- BIWEIGHT
- BW

- EPANECHNIKOV
- E

- UNIFORM
- U

- NMINGRID=number
specifies the number of grid points in determining the mean integrated square error (MISE). The default value is 51.
- NGRID=number
specifies the number of grid points. The default is 101.
- CL
displays the pointwise confidence limits for the smoothed hazard.
- LOGLOGS
- LLS
plots the log of negative log of estimated survivor functions versus the log of time.
- LOGSURV
- LS
plots the negative log of estimated survivor functions versus time.
- NONE
suppresses all plots.
- PDF <(CL)>
- P <(CL)>
plots the estimated probability density functions (life-table method only). Pointwise confidence limits are displayed optionally by specifying the CL option.
- SURVIVAL <(survival-options)>
- S <(survival-options)>
plots the estimated survivor functions. Censored times are plotted as a plus sign on the product-limit curves unless the NOCENSOR option is specified. You can customized the display by using the following survival-options.
- ATRISK <= number-list>
displays the numbers of subjects at risk at the given times. The number-list identifies the times at which the numbers at risk are displayed. If the number-list is not specified, PROC LIFETEST uses the default list
 , where
  and are computed by the following algorithm. Let
  be the MAXTIME= value or the largest observed time if the MAXTIME= option is not specified; let
 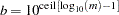 , where ceil() is the ceiling function.


- CB <=keyword>
- displays the confidence bands (that is, simulataneous confidence intervals) for the survivor functions. You can specify one of the following keywords. The default is CB=HW.
- ALL
displays both the equal-precision and the Hall-Wellner bands.
- EP
displays the equal-precision band.
- HW
displays the Hall-Wellner confidence band.
- CL
displays the pointwise confidence limits for the survivor functions.
- FAILURE
- F
changes all the displays for survivor functions to those for the failure functions. For example, if both the FAILURE and CL options are specified, the plot displays the failure curves as well as the pointwise confidence limits for the failure functions.
- NOCENSOR
suppresses plotting the censored times on the product-limit survival curves (product-limit method only).
- STRATA=strata-option
specifies how to display the survival/failure curves for multiple strata. This option has no effect if there is only one stratum. You can choose one of the following strata options:
- INDIVIDUAL
- UNPACK
specifies that a separate plot be displayed for each stratum.
- OVERLAY
specifies that the survival/failure curves for the strata be overlaid in one plot.
- PANEL
specifies that separate plots for the strata be organized into panels of two or four plots, depending on the number of strata.
- TEST
displays the p-value of a homogeneity test specified in the STRATA statement. If more than one test is produced, the test is chosen in the following order: LOGRANK, WILCOXON, TARONE, PETO, MODPETO, FLEMING, and LR.
- PLOTS=plot-request <(NAME=name | ’string’)>
- PLOTS=(plot-request <(NAME=name | ’string’)> <, ..., plot-request <(NAME=name | ’string’)> >)
controls plots produced in traditional graphics. To obtain traditional graphics, you must neither enable ODS Graphics nor specify the LINEPRINTER option. For each plot-request, you can use the NAME= option to specify a name to identify the plot. The name can be specified as a SAS name or as a quoted string of up to 256 characters. Only the first eight characters are used as the entry name in the GOUT= catalog. The plot-requests include the following:
- SURVIVAL
- S
plots the estimated survivor functions versus time.
- LOGSURV
- LS
plots the negative log of estimated survivor functions versus time.
- LOGLOGS
- LLS
plots the log of negative log of estimated survivor functions versus the log of time.
- HAZARD
- H
plots estimated hazard function versus time (life-table method only).
- P
plots the estimated probability density function versus time (life-table method only).
When you specify only one plot-request, you can omit the parentheses around the plot-request. Here are some examples:
    plots=s
    plots=(s(name=Surv2), h(name=Haz2))
The latter requests a plot of the estimated survivor function versus time and a plot of the estimated hazard function versus time, with Surv2 and Haz2 as their names in the GOUT= catalog, respectively.
- REDUCEOUT
specifies that the OUTSURV= data set contain only those observations that are included in the INTERVALS= or TIMELIST= option. This option has no effect if the OUTSURV= option is not specified. It also has no effect if neither the INTERVALS= option nor the TIMELIST= option is specified.
- SINGULAR=value
specifies the tolerance for testing singularity of the covariance matrix for the rank test statistics. The test requires that a pivot for sweeping a covariance matrix be at least this number times a norm of the matrix. The default value is 1E–12.
- STDERR
specifies that the standard error of the survivor function (SDF_STDERR) be output to the OUTSURV= data set. If the life-table method is used, the standard error of the density function (PDF_STDERR) and the standard error of the hazard function (HAZ_STDERR) are also output.
- TIMELIM=time-limit
- specifies the time limit used in the estimation of the mean survival time and its standard error. The mean survival time can be shown to be the area under the Kaplan-Meier survival curve. However, if the largest observed time in the data is censored, the area under the survival curve is not a closed area. In such a situation, you can choose a time limit
 and estimate the mean survival curve limited to a time (Lee; 1992, pp. 72–76). This option is ignored if the largest observed time is an event time. Valid time-limit values are as follows:
 - EVENT
- LET
specifies that the time limit
be the largest event time in the data. TIMELIM=EVENT is the default. - OBSERVED
- LOT
specifies that the time limit
be the largest observed time in the data. - number
specifies that the time limit
be the given number. The number must be positive and at least as large as the largest event time in the data.
- TIMELIST=number-list
specifies a list of time points at which the Kaplan-Meier estimates are displayed. The time points are listed in the column labeled Timelist. Since the Kaplan-Meier survival curve is a decreasing step function, each given time point falls in an interval that has a constant survival estimate. The event time that corresponds to the beginning of the time interval is displayed along with its survival estimate.
- WIDTH=value
sets the width of the intervals used in the life-table calculation of the survival function. This parameter is overridden by the INTERVALS= option.
Copyright © 2009 by SAS Institute Inc., Cary, NC, USA. All rights reserved.