| The LIFEREG Procedure |
Example 48.6 Probability Plotting—Arbitrary Censoring
Table 48.7 contains microprocessor failure data (Nelson; 1990). Units were inspected at predetermined time intervals. The data consist of inspection interval endpoints (in hours) and the number of units failing in each interval. A missing (.) lower endpoint indicates left censoring, and a missing upper endpoint indicates right censoring. These can be thought of as semi-infinite intervals with a lower (upper) endpoint of negative (positive) infinity for left (right) censoring.
Lower Endpoint |
Upper Endpoint |
Number Failed |
|---|---|---|
. |
6 |
6 |
6 |
12 |
2 |
24 |
48 |
2 |
24 |
. |
1 |
48 |
168 |
1 |
48 |
. |
839 |
168 |
500 |
1 |
168 |
. |
150 |
500 |
1000 |
2 |
500 |
. |
149 |
1000 |
2000 |
1 |
1000 |
. |
147 |
2000 |
. |
122 |
The following SAS statements create the SAS data set Micro:
   data Micro;
      input t1 t2 f ;
      datalines;
   . 6 6
   6 12 2
   12 24 0
   24 48 2
   24 .  1
   48 168 1
   48 .   839
   168 500 1
   168 .   150
   500 1000 2
   500 .    149
   1000 2000 1
   1000 . 147
   2000 . 122
   ;
   run;
The following SAS statements compute the nonparametric Turnbull estimate of the cumulative distribution function and create a lognormal probability plot:
   ods graphics on;
   proc lifereg data=Micro;
      model ( t1 t2 ) = / d=lognormal intercept=25 scale=5;
      weight f;
      probplot
      pupper = 10
      itprintem
      printprobs
      maxitem = (1000,25)
      ppout;
      inset;
   run;
   ods graphics off;
The two initial values INTERCEPT=25 and SCALE=5 in the MODEL statement are used to aid convergence in the model-fitting algorithm.
The following tables are created by the PROBPLOT statement in addition to the standard tabular output from the MODEL statement. Output 48.6.1 shows the iteration history for the Turnbull estimate of the CDF for the microprocessor data. With both options ITPRINTEM and PRINTPROBS specified in the PROBPLOT statement, this table contains the log likelihoods and interval probabilities for every 25th iteration and the last iteration. It would contain only the log likelihoods if the option PRINTPROBS were not specified.
| Iteration History for the Turnbull Estimate of the CDF | |||||||||
|---|---|---|---|---|---|---|---|---|---|
| Iteration | Loglikelihood | (., 6) | (6, 12) | (24, 48) | (48, 168) | (168, 500) | (500, 1000) | (1000, 2000) | (2000, .) |
| 0 | -1133.4051 | 0.125 | 0.125 | 0.125 | 0.125 | 0.125 | 0.125 | 0.125 | 0.125 |
| 25 | -104.16622 | 0.00421644 | 0.00140548 | 0.00140648 | 0.00173338 | 0.00237846 | 0.00846094 | 0.04565407 | 0.93474475 |
| 50 | -101.15151 | 0.00421644 | 0.00140548 | 0.00140648 | 0.00173293 | 0.00234891 | 0.00727679 | 0.01174486 | 0.96986811 |
| 75 | -101.06641 | 0.00421644 | 0.00140548 | 0.00140648 | 0.00173293 | 0.00234891 | 0.00727127 | 0.00835638 | 0.9732621 |
| 100 | -101.06534 | 0.00421644 | 0.00140548 | 0.00140648 | 0.00173293 | 0.00234891 | 0.00727125 | 0.00801814 | 0.97360037 |
| 125 | -101.06533 | 0.00421644 | 0.00140548 | 0.00140648 | 0.00173293 | 0.00234891 | 0.00727125 | 0.00798438 | 0.97363413 |
| 130 | -101.06533 | 0.00421644 | 0.00140548 | 0.00140648 | 0.00173293 | 0.00234891 | 0.00727125 | 0.007983 | 0.97363551 |
The table in Output 48.6.2 summarizes the Turnbull estimates of the interval probabilities, the reduced gradients, and Lagrange multipliers as described in the section Arbitrarily Censored Data.
Output 48.6.3 shows the final estimate of the CDF, along with standard errors and nonparametric confidence limits. Two kinds of nonparametric confidence limits, pointwise or simultaneous, are available. The default is the pointwise nonparametric confidence limits. You can specify the simultaneous nonparametric confidence limits by using the NPINTERVALS=SIMUL option.
| Cumulative Probability Estimates | |||||
|---|---|---|---|---|---|
| Lower Lifetime | Upper Lifetime | Cumulative Probability |
Pointwise 95% Confidence Limits |
Standard Error | |
| Lower | Upper | ||||
| 6 | 6 | 0.0042 | 0.0019 | 0.0094 | 0.0017 |
| 12 | 24 | 0.0056 | 0.0028 | 0.0112 | 0.0020 |
| 48 | 48 | 0.0070 | 0.0038 | 0.0130 | 0.0022 |
| 168 | 168 | 0.0088 | 0.0047 | 0.0164 | 0.0028 |
| 500 | 500 | 0.0111 | 0.0058 | 0.0211 | 0.0037 |
| 1000 | 1000 | 0.0184 | 0.0094 | 0.0357 | 0.0063 |
| 2000 | 2000 | 0.0264 | 0.0124 | 0.0553 | 0.0101 |
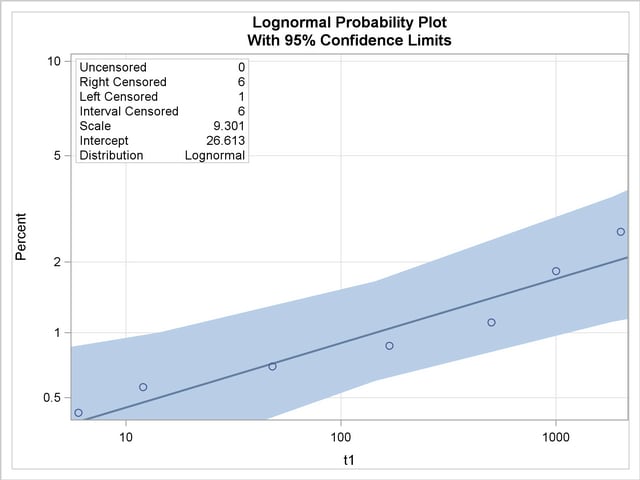
Output 48.6.4 shows the CDF estimates, maximum likelihood fit, and pointwise parametric confidence limits plotted on a lognormal probability plot.
Copyright © 2009 by SAS Institute Inc., Cary, NC, USA. All rights reserved.