| Introduction to Structural Equation Modeling with Latent Variables |
A Combined Measurement-Structural Model with Reciprocal Influence and Correlated Residuals
To illustrate a more complex model, this example uses some well-known data from Haller and Butterworth (1960). Various models and analyses of these data are given by Duncan, Haller, and Portes (1968), Jöreskog and Sörbom (1988), and Loehlin (1987).
The study is concerned with the career aspirations of high school students and how these aspirations are affected by close friends. The data are collected from 442 seventeen-year-old boys in Michigan. There are 329 boys in the sample who named another boy in the sample as a best friend. The observations to be analyzed consist of the data from these 329 boys paired with the data from their best friends.
The method of data collection introduces two statistical problems. First, restricting the analysis to boys whose best friends are in the original sample causes the reduced sample to be biased. Second, since the data from a given boy might appear in two or more observations, the observations are not independent. Therefore, any statistical conclusions should be considered tentative. It is difficult to accurately assess the effects of the dependence of the observations on the analysis, but it could be argued on intuitive grounds that since each observation has data from two boys and since it seems likely that many of the boys will appear in the data set at least twice, the effective sample size might be as small as half of the reported 329 observations.
The correlation matrix, taken from Jöreskog and Sörbom (1988), is shown in the following DATA step:
   title 'Peer Influences on Aspiration: Haller & Butterworth (1960)';
   data aspire(type=corr);
      _type_='corr';
      input _name_ $ riq rpa rses roa rea fiq fpa fses foa fea;
      label riq='Respondent: Intelligence'
            rpa='Respondent: Parental Aspiration'
            rses='Respondent: Family SES'
            roa='Respondent: Occupational Aspiration'
            rea='Respondent: Educational Aspiration'
            fiq='Friend: Intelligence'
            fpa='Friend: Parental Aspiration'
            fses='Friend: Family SES'
            foa='Friend: Occupational Aspiration'
            fea='Friend: Educational Aspiration';
      datalines;
   riq   1.      .      .      .      .      .       .      .      .      .
   rpa   .1839  1.      .      .      .      .       .      .      .      .
   rses  .2220  .0489  1.      .      .      .       .      .      .      .
   roa   .4105  .2137  .3240  1.      .      .       .      .      .      .
   rea   .4043  .2742  .4047  .6247  1.      .       .      .      .      .
   fiq   .3355  .0782  .2302  .2995  .2863  1.       .      .      .      .
   fpa   .1021  .1147  .0931  .0760  .0702  .2087   1.      .      .      .
   fses  .1861  .0186  .2707  .2930  .2407  .2950  -.0438  1.      .      .
   foa   .2598  .0839  .2786  .4216  .3275  .5007   .1988  .3607  1.      .
   fea   .2903  .1124  .3054  .3269  .3669  .5191   .2784  .4105  .6404  1.
   ;
The model analyzed by Jöreskog and Sörbom (1988) is displayed in the path diagram in Figure 17.17.
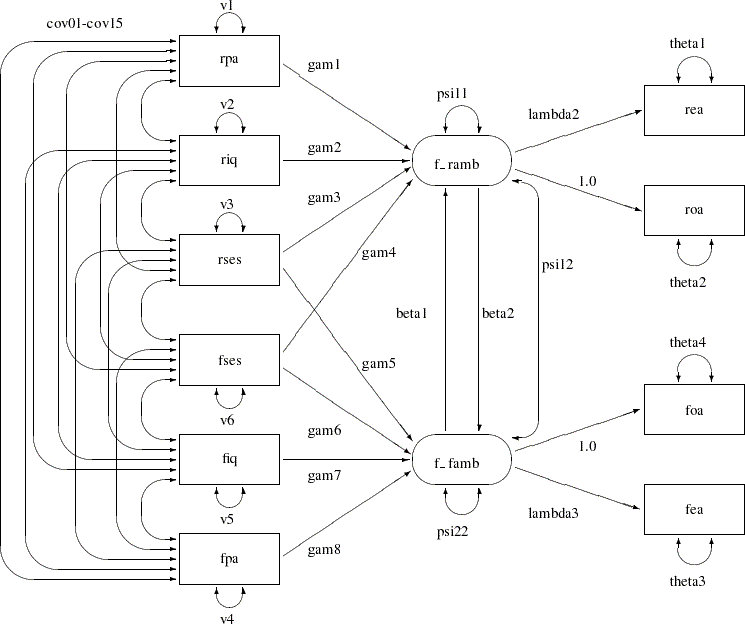
Two latent variables, f_ramb and f_famb, represent the respondent’s level of ambition and his best friend’s level of ambition, respectively. The model states that the respondent’s ambition is determined by his intelligence (riq) and socioeconomic status (rses), his perception of his parents’ aspiration for him (rpa), and his friend’s socioeconomic status (fses) and ambition (f_famb). It is assumed that his friend’s intelligence (fiq) and parental aspiration (fpa) affect the respondent’s ambition only indirectly through the friend’s ambition (f_famb). Ambition is indexed by the manifest variables of occupational (roa) and educational aspiration (rea), which are assumed to have uncorrelated residuals. The path coefficient from ambition to occupational aspiration is set to 1.0 to determine the scale of the ambition latent variable.
This model can be analyzed with PROC TCALIS by using the PATH modeling language, as shown in the following statements:
   proc tcalis corr data=aspire nobs=329;
      path
         /* measurement model for aspiration */
         rea <-  f_ramb    lambda2,
         roa <-  f_ramb    1.,
         foa <-  f_famb    1.,
         fea <-  f_famb    lambda3,
         /* structural model of influences */
         f_ramb <- rpa     gam1,
         f_ramb <- riq     gam2,
         f_ramb <- rses    gam3,
         f_ramb <- fses    gam4,
         f_famb <- rses    gam5,
         f_famb <- fses    gam6,
         f_famb <- fiq     gam7,
         f_famb <- fpa     gam8,
         f_ramb <- f_famb  beta1,
         f_famb <- f_ramb  beta2;
      pvar
         f_ramb = psi11,
         f_famb = psi22,
         rpa riq rses fpa fiq fses = v1-v6,
         rea roa fea foa = theta1-theta4;
      pcov
         f_ramb f_famb = psi12,
         rpa riq rses fpa fiq fses = 15 * cov__;
   run;
In this specification, the names of the parameters correspond to those used by Jöreskog and Sörbom (1988). Since this TYPE=CORR data set does not contain an observation with _TYPE_=’N’ giving the sample size, it is necessary to specify the NOBS= option in the PROC TCALIS statement.
Specifying a name followed by double underscores is a quick way to generate unique parameter names. The double underscores are replaced with a unique number each time a new parameter name is generated. For example, in the COV statement, the specification
rpa riq rses fpa fiq fses = 15 * cov__;
is equivalent to
rpa riq rses fpa fiq fses = cov01-cov15;
In the PROC TCALIS statement, the CORR option is used to indicate that the correlation matrix is fitted by the model. Fitting correlation matrices by covariance structure modeling method is plagued with some statistical issues. For example, the chi-square statistic might not follow the theoretical distribution well, and the estimates of standard errors might not be accurate. Nonetheless, the correlation matrix is fitted here for illustration and comparison purposes.
The results from this analysis are displayed in Figure 17.18.
| Fit Summary | ||
|---|---|---|
| Modeling Info | N Observations | 329 |
| N Variables | 10 | |
| N Moments | 55 | |
| N Parameters | 40 | |
| N Active Constraints | 0 | |
| Independence Model Chi-Square | 872.0008 | |
| Independence Model Chi-Square DF | 45 | |
| Absolute Index | Fit Function | 0.0814 |
| Chi-Square | 26.6972 | |
| Chi-Square DF | 15 | |
| Pr > Chi-Square | 0.0313 | |
| Z-Test of Wilson & Hilferty | 1.8625 | |
| Hoelter Critical N | 309 | |
| Root Mean Square Residual (RMSR) | 0.0202 | |
| Standardized RMSR (SRMSR) | 0.0202 | |
| Goodness of Fit Index (GFI) | 0.9844 | |
| Parsimony Index | Adjusted GFI (AGFI) | 0.9428 |
| Parsimonious GFI | 0.3281 | |
| RMSEA Estimate | 0.0488 | |
| RMSEA Lower 90% Confidence Limit | 0.0145 | |
| RMSEA Upper 90% Confidence Limit | 0.0783 | |
| Probability of Close Fit | 0.4876 | |
| ECVI Estimate | 0.3338 | |
| ECVI Lower 90% Confidence Limit | 0.3012 | |
| ECVI Upper 90% Confidence Limit | 0.3910 | |
| Akaike Information Criterion | -3.3028 | |
| Bozdogan CAIC | -75.2437 | |
| Schwarz Bayesian Criterion | -60.2437 | |
| McDonald Centrality | 0.9824 | |
| Incremental Index | Bentler Comparative Fit Index | 0.9859 |
| Bentler-Bonett NFI | 0.9694 | |
| Bentler-Bonett Non-normed Index | 0.9576 | |
| Bollen Normed Index Rho1 | 0.9082 | |
| Bollen Non-normed Index Delta2 | 0.9864 | |
| James et al. Parsimonious NFI | 0.3231 | |
Jöreskog and Sörbom (1988) present more detailed results from a second analysis in which two constraints are imposed:
The coefficients connecting the latent ambition variables are equal (that is, beta1
 beta2).
 The covariance of the disturbances of the ambition variables is zero (that is, psi12
 ).
).
This analysis can be performed by changing the names beta1 and beta2 to beta and omitting the line from the COV statement for psi12, as shown in the following statements:
   proc tcalis corr data=aspire nobs=329;
      path
         /* measurement model for aspiration */
         rea <-  f_ramb    lambda2,
         roa <-  f_ramb    1.,
         foa <-  f_famb    1.,
         fea <-  f_famb    lambda3,
         /* structural model of influences */
         f_ramb <- rpa     gam1,
         f_ramb <- riq     gam2,
         f_ramb <- rses    gam3,
         f_ramb <- fses    gam4,
         f_famb <- rses    gam5,
         f_famb <- fses    gam6,
         f_famb <- fiq     gam7,
         f_famb <- fpa     gam8,
         f_ramb <- f_famb  beta,
         f_famb <- f_ramb  beta;
      pvar
         f_ramb = psi11,
         f_famb = psi22,
         rpa riq rses fpa fiq fses = v1-v6,
         rea roa fea foa = theta1-theta4;
      pcov
         rpa riq rses fpa fiq fses = 15 * cov__;
    run;
The fit summary is displayed in Figure 17.19, and the estimation results are displayed in Figure 17.20.
| Fit Summary | ||
|---|---|---|
| Modeling Info | N Observations | 329 |
| N Variables | 10 | |
| N Moments | 55 | |
| N Parameters | 38 | |
| N Active Constraints | 0 | |
| Independence Model Chi-Square | 872.0008 | |
| Independence Model Chi-Square DF | 45 | |
| Absolute Index | Fit Function | 0.0820 |
| Chi-Square | 26.8987 | |
| Chi-Square DF | 17 | |
| Pr > Chi-Square | 0.0596 | |
| Z-Test of Wilson & Hilferty | 1.5599 | |
| Hoelter Critical N | 338 | |
| Root Mean Square Residual (RMSR) | 0.0203 | |
| Standardized RMSR (SRMSR) | 0.0203 | |
| Goodness of Fit Index (GFI) | 0.9843 | |
| Parsimony Index | Adjusted GFI (AGFI) | 0.9492 |
| Parsimonious GFI | 0.3718 | |
| RMSEA Estimate | 0.0421 | |
| RMSEA Lower 90% Confidence Limit | . | |
| RMSEA Upper 90% Confidence Limit | 0.0710 | |
| Probability of Close Fit | 0.6367 | |
| ECVI Estimate | 0.3218 | |
| ECVI Lower 90% Confidence Limit | . | |
| ECVI Upper 90% Confidence Limit | 0.3781 | |
| Akaike Information Criterion | -7.1013 | |
| Bozdogan CAIC | -88.6343 | |
| Schwarz Bayesian Criterion | -71.6343 | |
| McDonald Centrality | 0.9851 | |
| Incremental Index | Bentler Comparative Fit Index | 0.9880 |
| Bentler-Bonett NFI | 0.9692 | |
| Bentler-Bonett Non-normed Index | 0.9683 | |
| Bollen Normed Index Rho1 | 0.9183 | |
| Bollen Non-normed Index Delta2 | 0.9884 | |
| James et al. Parsimonious NFI | 0.3661 | |
| PATH List | ||||||
|---|---|---|---|---|---|---|
| Path | Parameter | Estimate | Standard Error |
t Value | ||
| rea | <- | f_ramb | lambda2 | 1.06097 | 0.08921 | 11.89233 |
| roa | <- | f_ramb | 1.00000 | |||
| foa | <- | f_famb | 1.00000 | |||
| fea | <- | f_famb | lambda3 | 1.07359 | 0.08063 | 13.31498 |
| f_ramb | <- | rpa | gam1 | 0.16367 | 0.03872 | 4.22740 |
| f_ramb | <- | riq | gam2 | 0.25395 | 0.04186 | 6.06725 |
| f_ramb | <- | rses | gam3 | 0.22115 | 0.04187 | 5.28219 |
| f_ramb | <- | fses | gam4 | 0.07728 | 0.04149 | 1.86264 |
| f_famb | <- | rses | gam5 | 0.06840 | 0.03868 | 1.76809 |
| f_famb | <- | fses | gam6 | 0.21839 | 0.03948 | 5.53198 |
| f_famb | <- | fiq | gam7 | 0.33063 | 0.04116 | 8.03314 |
| f_famb | <- | fpa | gam8 | 0.15204 | 0.03636 | 4.18169 |
| f_ramb | <- | f_famb | beta | 0.18007 | 0.03912 | 4.60305 |
| f_famb | <- | f_ramb | beta | 0.18007 | 0.03912 | 4.60305 |
| Variance Parameters | |||||
|---|---|---|---|---|---|
| Variance Type |
Variable | Parameter | Estimate | Standard Error |
t Value |
| Error | f_ramb | psi11 | 0.28113 | 0.04640 | 6.05867 |
| f_famb | psi22 | 0.22924 | 0.03889 | 5.89393 | |
| Exogenous | rpa | v1 | 1.00000 | 0.07809 | 12.80625 |
| riq | v2 | 1.00000 | 0.07809 | 12.80625 | |
| rses | v3 | 1.00000 | 0.07809 | 12.80625 | |
| fpa | v4 | 1.00000 | 0.07809 | 12.80625 | |
| fiq | v5 | 1.00000 | 0.07809 | 12.80625 | |
| fses | v6 | 1.00000 | 0.07809 | 12.80625 | |
| Error | rea | theta1 | 0.33764 | 0.05178 | 6.52039 |
| roa | theta2 | 0.41205 | 0.05103 | 8.07403 | |
| fea | theta3 | 0.31337 | 0.04574 | 6.85165 | |
| foa | theta4 | 0.40381 | 0.04608 | 8.76428 | |
| Covariances Among Exogenous Variables | |||||
|---|---|---|---|---|---|
| Var1 | Var2 | Parameter | Estimate | Standard Error |
t Value |
| rpa | riq | cov01 | 0.18390 | 0.05614 | 3.27564 |
| rpa | rses | cov02 | 0.04890 | 0.05528 | 0.88456 |
| riq | rses | cov03 | 0.22200 | 0.05656 | 3.92503 |
| rpa | fpa | cov04 | 0.11470 | 0.05558 | 2.06377 |
| riq | fpa | cov05 | 0.10210 | 0.05550 | 1.83955 |
| rses | fpa | cov06 | 0.09310 | 0.05545 | 1.67885 |
| rpa | fiq | cov07 | 0.07820 | 0.05538 | 1.41195 |
| riq | fiq | cov08 | 0.33550 | 0.05824 | 5.76060 |
| rses | fiq | cov09 | 0.23020 | 0.05666 | 4.06284 |
| fpa | fiq | cov10 | 0.20870 | 0.05641 | 3.70000 |
| rpa | fses | cov11 | 0.01860 | 0.05523 | 0.33680 |
| riq | fses | cov12 | 0.18610 | 0.05616 | 3.31352 |
| rses | fses | cov13 | 0.27070 | 0.05720 | 4.73226 |
| fpa | fses | cov14 | -0.04380 | 0.05527 | -0.79249 |
| fiq | fses | cov15 | 0.29500 | 0.05757 | 5.12435 |
The difference between the chi-square values for the two preceding models is  with
with  degrees of freedom, which is far from significant. This indicates that the restricted model (analysis 2) fits as well as the unrestricted model (analysis 1). However, the chi-square test of the restricted model against the alternative of a completely unrestricted covariance matrix yields a p-value of 0.0596, which indicates that the model might not be entirely satisfactory (p-values from these data are probably too small because of the dependence of the observations).
Loehlin (1987) points out that the models considered are unrealistic in at least two respects. First, the variables of parental aspiration, intelligence, and socioeconomic status are assumed to be measured without error. Loehlin adds uncorrelated measurement errors to the model and assumes, for illustrative purposes, that the reliabilities of these variables are known to be 0.7, 0.8, and 0.9, respectively. In practice, these reliabilities would need to be obtained from a separate study of the same or a very similar population. If these constraints are omitted, the model is not identified. However, constraining parameters to a constant in an analysis of a correlation matrix might make the chi-square goodness-of-fit test inaccurate, so there is more reason to be skeptical of the p-values. Second, the error terms for the respondent’s aspiration are assumed to be uncorrelated with the corresponding terms for his friend. Loehlin introduces a correlation between the two educational aspiration error terms and between the two occupational aspiration error terms. These additions produce the path diagram for Loehlin’s model 1 shown in Figure 17.21.
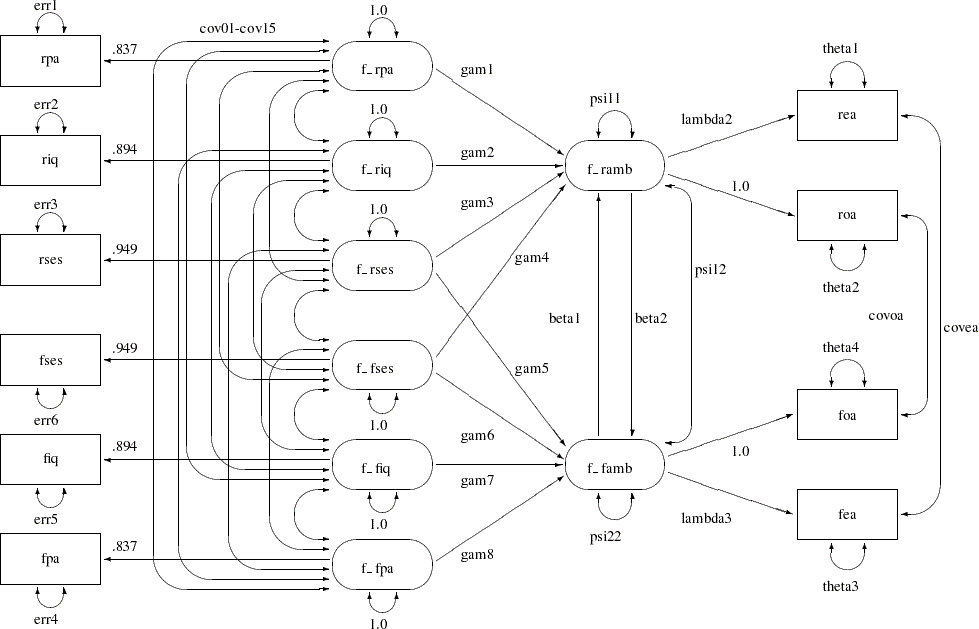
In Figure 17.21, the observed variables rpa, riq, rses, fses, fiq, and fpa are all treated as measurements with errors. Their purified counterparts f_rpa, f_riq, f_rses, f_fses, f_fiq, and f_fpa are latent variables created in the model to represent measurements without errors. Path coefficients from these latent variables to the observed variables are fixed coefficients, indicating the square roots of the theoretical reliabilities in the model. These latent variables, rather than the observed counterparts, serve as predictors of the ambition variables f_ramb and f_famb. Correlated errors for the occupational aspiration variables and the educational aspiration variables are also shown in Figure 17.21. The error covariance for the educational aspiration variables rea and fea is indicated by the parameter covea, and the error covariance for the occupational aspiration variables roa and foa is indicated by the parameter covoa.
The statements for fitting this model by using the PATH modeling language are as follows:
   proc tcalis corr data=aspire nobs=329;
      path
         /* measurement model for aspiration */
         rea  <-  f_ramb    lambda2,
         roa  <-  f_ramb    1.,
         foa  <-  f_famb    1.,
         fea  <-  f_famb    lambda3,

         /* measurement model for intelligence and environment */
         rpa  <-  f_rpa     0.837,
         riq  <-  f_riq     0.894,
         rses <-  f_rses    0.949,
         fses <-  f_fses    0.949,
         fiq  <-  f_fiq     0.894,
         fpa  <-  f_fpa     0.837,

         /* structural model of influences */
         f_ramb <- f_rpa     gam1,
         f_ramb <- f_riq     gam2,
         f_ramb <- f_rses    gam3,
         f_ramb <- f_fses    gam4,
         f_famb <- f_rses    gam5,
         f_famb <- f_fses    gam6,
         f_famb <- f_fiq     gam7,
         f_famb <- f_fpa     gam8,
         f_ramb <- f_famb    beta1,
         f_famb <- f_ramb    beta2;
      pvar
         f_ramb = psi11,
         f_famb = psi22,
         f_rpa f_riq f_rses f_fses f_fiq f_fpa = 6 * 1.0,
         rea roa fea foa                       = theta1-theta4,
         rpa riq rses fpa fiq fses             = err1-err6;
      pcov
         f_ramb f_famb   = psi12,
         rea  fea        = covea,
         roa  foa        = covoa,
         f_rpa f_riq f_rses f_fses f_fiq f_fpa = 15 * cov__;
   run;
The fit summary is displayed in Figure 17.22, and the estimation results are displayed in Figure 17.23.
| Fit Summary | ||
|---|---|---|
| Modeling Info | N Observations | 329 |
| N Variables | 10 | |
| N Moments | 55 | |
| N Parameters | 42 | |
| N Active Constraints | 0 | |
| Independence Model Chi-Square | 872.0008 | |
| Independence Model Chi-Square DF | 45 | |
| Absolute Index | Fit Function | 0.0366 |
| Chi-Square | 12.0132 | |
| Chi-Square DF | 13 | |
| Pr > Chi-Square | 0.5266 | |
| Z-Test of Wilson & Hilferty | -0.0679 | |
| Hoelter Critical N | 612 | |
| Root Mean Square Residual (RMSR) | 0.0149 | |
| Standardized RMSR (SRMSR) | 0.0149 | |
| Goodness of Fit Index (GFI) | 0.9927 | |
| Parsimony Index | Adjusted GFI (AGFI) | 0.9692 |
| Parsimonious GFI | 0.2868 | |
| RMSEA Estimate | 0.0000 | |
| RMSEA Lower 90% Confidence Limit | . | |
| RMSEA Upper 90% Confidence Limit | 0.0512 | |
| Probability of Close Fit | 0.9435 | |
| ECVI Estimate | 0.3016 | |
| ECVI Lower 90% Confidence Limit | . | |
| ECVI Upper 90% Confidence Limit | 0.3392 | |
| Akaike Information Criterion | -13.9868 | |
| Bozdogan CAIC | -76.3356 | |
| Schwarz Bayesian Criterion | -63.3356 | |
| McDonald Centrality | 1.0015 | |
| Incremental Index | Bentler Comparative Fit Index | 1.0000 |
| Bentler-Bonett NFI | 0.9862 | |
| Bentler-Bonett Non-normed Index | 1.0041 | |
| Bollen Normed Index Rho1 | 0.9523 | |
| Bollen Non-normed Index Delta2 | 1.0011 | |
| James et al. Parsimonious NFI | 0.2849 | |
| PATH List | ||||||
|---|---|---|---|---|---|---|
| Path | Parameter | Estimate | Standard Error |
t Value | ||
| rea | <- | f_ramb | lambda2 | 1.08398 | 0.09417 | 11.51054 |
| roa | <- | f_ramb | 1.00000 | |||
| foa | <- | f_famb | 1.00000 | |||
| fea | <- | f_famb | lambda3 | 1.11631 | 0.08627 | 12.93937 |
| rpa | <- | f_rpa | 0.83700 | |||
| riq | <- | f_riq | 0.89400 | |||
| rses | <- | f_rses | 0.94900 | |||
| fses | <- | f_fses | 0.94900 | |||
| fiq | <- | f_fiq | 0.89400 | |||
| fpa | <- | f_fpa | 0.83700 | |||
| f_ramb | <- | f_rpa | gam1 | 0.18370 | 0.05044 | 3.64201 |
| f_ramb | <- | f_riq | gam2 | 0.28004 | 0.06139 | 4.56183 |
| f_ramb | <- | f_rses | gam3 | 0.22616 | 0.05223 | 4.33004 |
| f_ramb | <- | f_fses | gam4 | 0.08698 | 0.05476 | 1.58836 |
| f_famb | <- | f_rses | gam5 | 0.06327 | 0.05219 | 1.21240 |
| f_famb | <- | f_fses | gam6 | 0.21539 | 0.05121 | 4.20600 |
| f_famb | <- | f_fiq | gam7 | 0.35386 | 0.06741 | 5.24971 |
| f_famb | <- | f_fpa | gam8 | 0.16877 | 0.04934 | 3.42051 |
| f_ramb | <- | f_famb | beta1 | 0.11897 | 0.11396 | 1.04397 |
| f_famb | <- | f_ramb | beta2 | 0.13022 | 0.12067 | 1.07921 |
| Variance Parameters | |||||
|---|---|---|---|---|---|
| Variance Type |
Variable | Parameter | Estimate | Standard Error |
t Value |
| Error | f_ramb | psi11 | 0.25418 | 0.04469 | 5.68738 |
| f_famb | psi22 | 0.19698 | 0.03814 | 5.16533 | |
| Exogenous | f_rpa | 1.00000 | |||
| f_riq | 1.00000 | ||||
| f_rses | 1.00000 | ||||
| f_fses | 1.00000 | ||||
| f_fiq | 1.00000 | ||||
| f_fpa | 1.00000 | ||||
| Error | rea | theta1 | 0.32707 | 0.05452 | 5.99883 |
| roa | theta2 | 0.42307 | 0.05243 | 8.06948 | |
| fea | theta3 | 0.28715 | 0.04804 | 5.97748 | |
| foa | theta4 | 0.42240 | 0.04730 | 8.93103 | |
| rpa | err1 | 0.29584 | 0.07774 | 3.80573 | |
| riq | err2 | 0.20874 | 0.07832 | 2.66519 | |
| rses | err3 | 0.09887 | 0.07803 | 1.26715 | |
| fpa | err4 | 0.29987 | 0.07807 | 3.84089 | |
| fiq | err5 | 0.19988 | 0.07674 | 2.60475 | |
| fses | err6 | 0.10324 | 0.07824 | 1.31950 | |
| Covariances Among Exogenous Variables | |||||
|---|---|---|---|---|---|
| Var1 | Var2 | Parameter | Estimate | Standard Error |
t Value |
| f_rpa | f_riq | cov01 | 0.24677 | 0.07519 | 3.28204 |
| f_rpa | f_rses | cov02 | 0.06184 | 0.06945 | 0.89034 |
| f_riq | f_rses | cov03 | 0.26351 | 0.06687 | 3.94075 |
| f_rpa | f_fses | cov04 | 0.02383 | 0.06952 | 0.34272 |
| f_riq | f_fses | cov05 | 0.22135 | 0.06648 | 3.32976 |
| f_rses | f_fses | cov06 | 0.30156 | 0.06359 | 4.74205 |
| f_rpa | f_fiq | cov07 | 0.10853 | 0.07362 | 1.47419 |
| f_riq | f_fiq | cov08 | 0.42476 | 0.07219 | 5.88373 |
| f_rses | f_fiq | cov09 | 0.27250 | 0.06660 | 4.09143 |
| f_fses | f_fiq | cov10 | 0.34922 | 0.06771 | 5.15755 |
| f_rpa | f_fpa | cov11 | 0.15789 | 0.07873 | 2.00553 |
| f_riq | f_fpa | cov12 | 0.13085 | 0.07418 | 1.76393 |
| f_rses | f_fpa | cov13 | 0.11517 | 0.06978 | 1.65053 |
| f_fses | f_fpa | cov14 | -0.05623 | 0.06971 | -0.80655 |
| f_fiq | f_fpa | cov15 | 0.27867 | 0.07530 | 3.70083 |
Since the p-value for the chi-square test is  , this model clearly cannot be rejected. However, Schwarz’s Bayesian criterion for this model (SBC
  ) is somewhat larger than for Jöreskog and Sörbom’s (1988) analysis 2 (SBC
  ), suggesting that a more parsimonious model would be desirable.
Since it is assumed that the same model applies to all the boys in the sample, the path diagram should be symmetric with respect to the respondent and his friend. In particular, the corresponding coefficients should be equal. By imposing equality constraints on the  pairs of corresponding coefficients, this example obtains Loehlin’s (1987) model 2. The PATH model is as follows, where an OUTMODEL= data set is created to facilitate subsequent hypothesis tests:
   proc tcalis corr data=aspire nobs=329 outmodel=model2;
      path
         /* measurement model for aspiration */
         rea  <-  f_ramb    lambda,              /* 1 ec! */
         roa  <-  f_ramb    1.,
         foa  <-  f_famb    1.,
         fea  <-  f_famb    lambda,

         /* measurement model for intelligence and environment */
         rpa  <-  f_rpa     0.837,
         riq  <-  f_riq     0.894,
         rses <-  f_rses    0.949,
         fses <-  f_fses    0.949,
         fiq  <-  f_fiq     0.894,
         fpa  <-  f_fpa     0.837,

         /* structural model of influences */
         f_ramb <- f_rpa     gam1,               /* 5 ec! */
         f_ramb <- f_riq     gam2,
         f_ramb <- f_rses    gam3,
         f_ramb <- f_fses    gam4,
         f_famb <- f_rses    gam4,
         f_famb <- f_fses    gam3,
         f_famb <- f_fiq     gam2,
         f_famb <- f_fpa     gam1,
         f_ramb <- f_famb    beta,
         f_famb <- f_ramb    beta;
      pvar
         f_ramb = psi,                           /* 1 ec! */
         f_famb = psi,
         f_rpa f_riq f_rses f_fpa f_fiq f_fses = 6 * 1.0,
         rea fea                 = 2 * thetaea,  /* 2 ec! */
         roa foa                 = 2 * thetaoa,
         rpa fpa                 = errpa1 errpa2,
         riq fiq                 = erriq1 erriq2,
         rses fses               = errses1 errses2;
      pcov
         f_ramb f_famb           = psi12,
         rea  fea                = covea,
         roa  foa                = covoa,
         f_rpa f_riq f_rses      = cov1-cov3,          /* 3 ec! */
         f_fpa f_fiq f_fses      = cov1-cov3,
         f_rpa f_riq f_rses * f_fpa f_fiq f_fses =     /* 3 ec! */
             cov4 cov5 cov6
             cov5 cov7 cov8
             cov6 cov8 cov9;
   run;
The fit summary is displayed in Figure 17.24, and the estimation results are displayed in Figure 17.25.
| Fit Summary | ||
|---|---|---|
| Modeling Info | N Observations | 329 |
| N Variables | 10 | |
| N Moments | 55 | |
| N Parameters | 27 | |
| N Active Constraints | 0 | |
| Independence Model Chi-Square | 872.0008 | |
| Independence Model Chi-Square DF | 45 | |
| Absolute Index | Fit Function | 0.0581 |
| Chi-Square | 19.0697 | |
| Chi-Square DF | 28 | |
| Pr > Chi-Square | 0.8960 | |
| Z-Test of Wilson & Hilferty | -1.2599 | |
| Hoelter Critical N | 713 | |
| Root Mean Square Residual (RMSR) | 0.0276 | |
| Standardized RMSR (SRMSR) | 0.0276 | |
| Goodness of Fit Index (GFI) | 0.9884 | |
| Parsimony Index | Adjusted GFI (AGFI) | 0.9772 |
| Parsimonious GFI | 0.6150 | |
| RMSEA Estimate | 0.0000 | |
| RMSEA Lower 90% Confidence Limit | . | |
| RMSEA Upper 90% Confidence Limit | 0.0194 | |
| Probability of Close Fit | 0.9996 | |
| ECVI Estimate | 0.2285 | |
| ECVI Lower 90% Confidence Limit | . | |
| ECVI Upper 90% Confidence Limit | 0.2664 | |
| Akaike Information Criterion | -36.9303 | |
| Bozdogan CAIC | -171.2200 | |
| Schwarz Bayesian Criterion | -143.2200 | |
| McDonald Centrality | 1.0137 | |
| Incremental Index | Bentler Comparative Fit Index | 1.0000 |
| Bentler-Bonett NFI | 0.9781 | |
| Bentler-Bonett Non-normed Index | 1.0174 | |
| Bollen Normed Index Rho1 | 0.9649 | |
| Bollen Non-normed Index Delta2 | 1.0106 | |
| James et al. Parsimonious NFI | 0.6086 | |
| PATH List | ||||||
|---|---|---|---|---|---|---|
| Path | Parameter | Estimate | Standard Error |
t Value | ||
| rea | <- | f_ramb | lambda | 1.10067 | 0.06842 | 16.08795 |
| roa | <- | f_ramb | 1.00000 | |||
| foa | <- | f_famb | 1.00000 | |||
| fea | <- | f_famb | lambda | 1.10067 | 0.06842 | 16.08795 |
| rpa | <- | f_rpa | 0.83700 | |||
| riq | <- | f_riq | 0.89400 | |||
| rses | <- | f_rses | 0.94900 | |||
| fses | <- | f_fses | 0.94900 | |||
| fiq | <- | f_fiq | 0.89400 | |||
| fpa | <- | f_fpa | 0.83700 | |||
| f_ramb | <- | f_rpa | gam1 | 0.17585 | 0.03508 | 5.01299 |
| f_ramb | <- | f_riq | gam2 | 0.32234 | 0.04702 | 6.85568 |
| f_ramb | <- | f_rses | gam3 | 0.22273 | 0.03629 | 6.13725 |
| f_ramb | <- | f_fses | gam4 | 0.07564 | 0.03750 | 2.01699 |
| f_famb | <- | f_rses | gam4 | 0.07564 | 0.03750 | 2.01699 |
| f_famb | <- | f_fses | gam3 | 0.22273 | 0.03629 | 6.13725 |
| f_famb | <- | f_fiq | gam2 | 0.32234 | 0.04702 | 6.85568 |
| f_famb | <- | f_fpa | gam1 | 0.17585 | 0.03508 | 5.01299 |
| f_ramb | <- | f_famb | beta | 0.11578 | 0.08390 | 1.38007 |
| f_famb | <- | f_ramb | beta | 0.11578 | 0.08390 | 1.38007 |
| Variance Parameters | |||||
|---|---|---|---|---|---|
| Variance Type |
Variable | Parameter | Estimate | Standard Error |
t Value |
| Error | f_ramb | psi | 0.22456 | 0.02971 | 7.55930 |
| f_famb | psi | 0.22456 | 0.02971 | 7.55930 | |
| Exogenous | f_rpa | 1.00000 | |||
| f_riq | 1.00000 | ||||
| f_rses | 1.00000 | ||||
| f_fpa | 1.00000 | ||||
| f_fiq | 1.00000 | ||||
| f_fses | 1.00000 | ||||
| Error | rea | thetaea | 0.30662 | 0.03726 | 8.22956 |
| fea | thetaea | 0.30662 | 0.03726 | 8.22956 | |
| roa | thetaoa | 0.42295 | 0.03651 | 11.58311 | |
| foa | thetaoa | 0.42295 | 0.03651 | 11.58311 | |
| rpa | errpa1 | 0.30758 | 0.07511 | 4.09498 | |
| fpa | errpa2 | 0.28834 | 0.07369 | 3.91289 | |
| riq | erriq1 | 0.26656 | 0.07389 | 3.60730 | |
| fiq | erriq2 | 0.15573 | 0.06700 | 2.32445 | |
| rses | errses1 | 0.11467 | 0.07267 | 1.57800 | |
| fses | errses2 | 0.08814 | 0.07089 | 1.24333 | |
| Covariances Among Exogenous Variables | |||||
|---|---|---|---|---|---|
| Var1 | Var2 | Parameter | Estimate | Standard Error |
t Value |
| f_rpa | f_riq | cov1 | 0.26470 | 0.05442 | 4.86370 |
| f_rpa | f_rses | cov2 | 0.00177 | 0.04996 | 0.03533 |
| f_riq | f_rses | cov3 | 0.31129 | 0.05057 | 6.15553 |
| f_fpa | f_fiq | cov1 | 0.26470 | 0.05442 | 4.86370 |
| f_fpa | f_fses | cov2 | 0.00177 | 0.04996 | 0.03533 |
| f_fiq | f_fses | cov3 | 0.31129 | 0.05057 | 6.15553 |
| f_rpa | f_fpa | cov4 | 0.15784 | 0.07872 | 2.00521 |
| f_rpa | f_fiq | cov5 | 0.11837 | 0.05447 | 2.17325 |
| f_rpa | f_fses | cov6 | 0.06910 | 0.04996 | 1.38303 |
| f_riq | f_fpa | cov5 | 0.11837 | 0.05447 | 2.17325 |
| f_riq | f_fiq | cov7 | 0.43061 | 0.07258 | 5.93255 |
| f_riq | f_fses | cov8 | 0.24967 | 0.05060 | 4.93420 |
| f_rses | f_fpa | cov6 | 0.06910 | 0.04996 | 1.38303 |
| f_rses | f_fiq | cov8 | 0.24967 | 0.05060 | 4.93420 |
| f_rses | f_fses | cov9 | 0.30190 | 0.06362 | 4.74578 |
The test of Loehlin’s (1987) model 2 against model 1 yields a chi-square of  with degrees of freedom, which is clearly not significant. This indicates the restricted model 2 fits at least as well as model 1. Schwarz’s Bayesian criterion (SBC) is also much lower for model 2 (
 ) than for model 1 (
 ). Hence, model 2 seems preferable on both substantive and statistical grounds.
A question of substantive interest is whether the friend’s socioeconomic status (SES) has a significant direct influence on a boy’s ambition. This can be addressed by omitting the paths from f_fses to f_ramb and from f_rses to f_famb designated by the parameter name gam4, yielding Loehlin’s (1987) model 3:
   title2 'Loehlin (1987) analysis: Model 3';
   data model3(type=calismdl);
      set model2;
      if _name_='gam4' then
         do;
            _name_=' ';
            _estim_=0;
         end;
   run;
   proc tcalis corr data=aspire nobs=329 inmodel=model3;
   run;
The fit summary is displayed in Figure 17.26.
| Fit Summary | ||
|---|---|---|
| Modeling Info | N Observations | 329 |
| N Variables | 10 | |
| N Moments | 55 | |
| N Parameters | 26 | |
| N Active Constraints | 0 | |
| Independence Model Chi-Square | 872.0008 | |
| Independence Model Chi-Square DF | 45 | |
| Absolute Index | Fit Function | 0.0702 |
| Chi-Square | 23.0365 | |
| Chi-Square DF | 29 | |
| Pr > Chi-Square | 0.7749 | |
| Z-Test of Wilson & Hilferty | -0.7563 | |
| Hoelter Critical N | 607 | |
| Root Mean Square Residual (RMSR) | 0.0304 | |
| Standardized RMSR (SRMSR) | 0.0304 | |
| Goodness of Fit Index (GFI) | 0.9858 | |
| Parsimony Index | Adjusted GFI (AGFI) | 0.9731 |
| Parsimonious GFI | 0.6353 | |
| RMSEA Estimate | 0.0000 | |
| RMSEA Lower 90% Confidence Limit | . | |
| RMSEA Upper 90% Confidence Limit | 0.0295 | |
| Probability of Close Fit | 0.9984 | |
| ECVI Estimate | 0.2343 | |
| ECVI Lower 90% Confidence Limit | . | |
| ECVI Upper 90% Confidence Limit | 0.2780 | |
| Akaike Information Criterion | -34.9635 | |
| Bozdogan CAIC | -174.0492 | |
| Schwarz Bayesian Criterion | -145.0492 | |
| McDonald Centrality | 1.0091 | |
| Incremental Index | Bentler Comparative Fit Index | 1.0000 |
| Bentler-Bonett NFI | 0.9736 | |
| Bentler-Bonett Non-normed Index | 1.0112 | |
| Bollen Normed Index Rho1 | 0.9590 | |
| Bollen Non-normed Index Delta2 | 1.0071 | |
| James et al. Parsimonious NFI | 0.6274 | |
The chi-square value for testing model 3 versus model 2 is  with
with  degree of freedom and a p-value of
  . Although the parameter is of marginal significance, the estimate in model 2 (
 ) is small compared to the other coefficients, and SBC indicates that model 3 is preferable to model 2.
Another important question is whether the reciprocal influences between the respondent’s and friend’s ambitions are needed in the model. To test whether these paths are zero, set the parameter beta for the paths linking f_ramb and f_famb to zero to obtain Loehlin’s (1987) model 4:
   title2 'Loehlin (1987) analysis: Model 4';
   data model4(type=calismdl);
      set model2;
      if _name_='beta' then
         do;
            _name_=' ';
            _estim_=0;
         end;
   run;
   proc tcalis corr data=aspire nobs=329 inmodel=model4;
   run;
The fit summary is displayed in Figure 17.27, and the estimation results are displayed in Figure 17.28.
| Fit Summary | ||
|---|---|---|
| Modeling Info | N Observations | 329 |
| N Variables | 10 | |
| N Moments | 55 | |
| N Parameters | 26 | |
| N Active Constraints | 0 | |
| Independence Model Chi-Square | 872.0008 | |
| Independence Model Chi-Square DF | 45 | |
| Absolute Index | Fit Function | 0.0640 |
| Chi-Square | 20.9981 | |
| Chi-Square DF | 29 | |
| Pr > Chi-Square | 0.8592 | |
| Z-Test of Wilson & Hilferty | -1.0780 | |
| Hoelter Critical N | 666 | |
| Root Mean Square Residual (RMSR) | 0.0304 | |
| Standardized RMSR (SRMSR) | 0.0304 | |
| Goodness of Fit Index (GFI) | 0.9873 | |
| Parsimony Index | Adjusted GFI (AGFI) | 0.9760 |
| Parsimonious GFI | 0.6363 | |
| RMSEA Estimate | 0.0000 | |
| RMSEA Lower 90% Confidence Limit | . | |
| RMSEA Upper 90% Confidence Limit | 0.0234 | |
| Probability of Close Fit | 0.9994 | |
| ECVI Estimate | 0.2281 | |
| ECVI Lower 90% Confidence Limit | . | |
| ECVI Upper 90% Confidence Limit | 0.2685 | |
| Akaike Information Criterion | -37.0019 | |
| Bozdogan CAIC | -176.0876 | |
| Schwarz Bayesian Criterion | -147.0876 | |
| McDonald Centrality | 1.0122 | |
| Incremental Index | Bentler Comparative Fit Index | 1.0000 |
| Bentler-Bonett NFI | 0.9759 | |
| Bentler-Bonett Non-normed Index | 1.0150 | |
| Bollen Normed Index Rho1 | 0.9626 | |
| Bollen Non-normed Index Delta2 | 1.0095 | |
| James et al. Parsimonious NFI | 0.6289 | |
| PATH List | ||||||
|---|---|---|---|---|---|---|
| Path | Parameter | Estimate | Standard Error |
t Value | ||
| rea | <- | f_ramb | lambda | 1.10505 | 0.06804 | 16.24157 |
| roa | <- | f_ramb | 1.00000 | |||
| foa | <- | f_famb | 1.00000 | |||
| fea | <- | f_famb | lambda | 1.10505 | 0.06804 | 16.24157 |
| rpa | <- | f_rpa | 0.83700 | |||
| riq | <- | f_riq | 0.89400 | |||
| rses | <- | f_rses | 0.94900 | |||
| fses | <- | f_fses | 0.94900 | |||
| fiq | <- | f_fiq | 0.89400 | |||
| fpa | <- | f_fpa | 0.83700 | |||
| f_ramb | <- | f_rpa | gam1 | 0.17760 | 0.03610 | 4.91945 |
| f_ramb | <- | f_riq | gam2 | 0.34856 | 0.04625 | 7.53618 |
| f_ramb | <- | f_rses | gam3 | 0.23834 | 0.03549 | 6.71576 |
| f_ramb | <- | f_fses | gam4 | 0.10810 | 0.02992 | 3.61340 |
| f_famb | <- | f_rses | gam4 | 0.10810 | 0.02992 | 3.61340 |
| f_famb | <- | f_fses | gam3 | 0.23834 | 0.03549 | 6.71576 |
| f_famb | <- | f_fiq | gam2 | 0.34856 | 0.04625 | 7.53618 |
| f_famb | <- | f_fpa | gam1 | 0.17760 | 0.03610 | 4.91945 |
| f_ramb | <- | f_famb | 0 | |||
| f_famb | <- | f_ramb | 0 | |||
| Variance Parameters | |||||
|---|---|---|---|---|---|
| Variance Type |
Variable | Parameter | Estimate | Standard Error |
t Value |
| Error | f_ramb | psi | 0.22738 | 0.03140 | 7.24263 |
| f_famb | psi | 0.22738 | 0.03140 | 7.24263 | |
| Exogenous | f_rpa | 1.00000 | |||
| f_riq | 1.00000 | ||||
| f_rses | 1.00000 | ||||
| f_fpa | 1.00000 | ||||
| f_fiq | 1.00000 | ||||
| f_fses | 1.00000 | ||||
| Error | rea | thetaea | 0.30502 | 0.03728 | 8.18091 |
| fea | thetaea | 0.30502 | 0.03728 | 8.18091 | |
| roa | thetaoa | 0.42429 | 0.03645 | 11.64071 | |
| foa | thetaoa | 0.42429 | 0.03645 | 11.64071 | |
| rpa | errpa1 | 0.31354 | 0.07543 | 4.15664 | |
| fpa | errpa2 | 0.29051 | 0.07374 | 3.93945 | |
| riq | erriq1 | 0.29611 | 0.07299 | 4.05703 | |
| fiq | erriq2 | 0.18181 | 0.06611 | 2.75034 | |
| rses | errses1 | 0.12320 | 0.07273 | 1.69400 | |
| fses | errses2 | 0.09873 | 0.07109 | 1.38881 | |
| Covariances Among Exogenous Variables | |||||
|---|---|---|---|---|---|
| Var1 | Var2 | Parameter | Estimate | Standard Error |
t Value |
| f_rpa | f_riq | cov1 | 0.27241 | 0.05520 | 4.93523 |
| f_rpa | f_rses | cov2 | 0.00476 | 0.05032 | 0.09455 |
| f_riq | f_rses | cov3 | 0.32463 | 0.05089 | 6.37870 |
| f_fpa | f_fiq | cov1 | 0.27241 | 0.05520 | 4.93523 |
| f_fpa | f_fses | cov2 | 0.00476 | 0.05032 | 0.09455 |
| f_fiq | f_fses | cov3 | 0.32463 | 0.05089 | 6.37870 |
| f_rpa | f_fpa | cov4 | 0.16949 | 0.07863 | 2.15559 |
| f_rpa | f_fiq | cov5 | 0.13539 | 0.05407 | 2.50384 |
| f_rpa | f_fses | cov6 | 0.07362 | 0.05027 | 1.46453 |
| f_riq | f_fpa | cov5 | 0.13539 | 0.05407 | 2.50384 |
| f_riq | f_fiq | cov7 | 0.46893 | 0.06980 | 6.71822 |
| f_riq | f_fses | cov8 | 0.26289 | 0.05093 | 5.16164 |
| f_rses | f_fpa | cov6 | 0.07362 | 0.05027 | 1.46453 |
| f_rses | f_fiq | cov8 | 0.26289 | 0.05093 | 5.16164 |
| f_rses | f_fses | cov9 | 0.30880 | 0.06409 | 4.81849 |
The chi-square value for testing model 4 versus model 2 is  with degree of freedom and a p-value of
  . Hence, there is little evidence of reciprocal influence.
Loehlin’s (1987) model 2 has not only the direct paths connecting the latent ambition variables f_ramb and f_famb but also a covariance between the disturbance terms d_ramb and d_famb to allow for other variables omitted from the model that might jointly influence the respondent and his friend. To test the hypothesis that this covariance is zero, set the parameter psi12 to zero, yielding Loehlin’s (1987) model 5:
   title2 'Loehlin (1987) analysis: Model 5';
   data model5(type=calismdl);
      set model2;
      if _name_='psi12' then
         do;
            _name_=' ';
            _estim_=0;
         end;
   run;
   proc tcalis corr data=aspire nobs=329 inmodel=model5;
   run;
The fit summary is displayed in Figure 17.29, and the estimation results are displayed in Figure 17.30.
| Fit Summary | ||
|---|---|---|
| Modeling Info | N Observations | 329 |
| N Variables | 10 | |
| N Moments | 55 | |
| N Parameters | 26 | |
| N Active Constraints | 0 | |
| Independence Model Chi-Square | 872.0008 | |
| Independence Model Chi-Square DF | 45 | |
| Absolute Index | Fit Function | 0.0582 |
| Chi-Square | 19.0745 | |
| Chi-Square DF | 29 | |
| Pr > Chi-Square | 0.9194 | |
| Z-Test of Wilson & Hilferty | -1.4014 | |
| Hoelter Critical N | 733 | |
| Root Mean Square Residual (RMSR) | 0.0276 | |
| Standardized RMSR (SRMSR) | 0.0276 | |
| Goodness of Fit Index (GFI) | 0.9884 | |
| Parsimony Index | Adjusted GFI (AGFI) | 0.9780 |
| Parsimonious GFI | 0.6370 | |
| RMSEA Estimate | 0.0000 | |
| RMSEA Lower 90% Confidence Limit | . | |
| RMSEA Upper 90% Confidence Limit | 0.0152 | |
| Probability of Close Fit | 0.9998 | |
| ECVI Estimate | 0.2222 | |
| ECVI Lower 90% Confidence Limit | . | |
| ECVI Upper 90% Confidence Limit | 0.2592 | |
| Akaike Information Criterion | -38.9255 | |
| Bozdogan CAIC | -178.0111 | |
| Schwarz Bayesian Criterion | -149.0111 | |
| McDonald Centrality | 1.0152 | |
| Incremental Index | Bentler Comparative Fit Index | 1.0000 |
| Bentler-Bonett NFI | 0.9781 | |
| Bentler-Bonett Non-normed Index | 1.0186 | |
| Bollen Normed Index Rho1 | 0.9661 | |
| Bollen Non-normed Index Delta2 | 1.0118 | |
| James et al. Parsimonious NFI | 0.6303 | |
| PATH List | ||||||
|---|---|---|---|---|---|---|
| Path | Parameter | Estimate | Standard Error |
t Value | ||
| rea | <- | f_ramb | lambda | 1.10086 | 0.06836 | 16.10408 |
| roa | <- | f_ramb | 1.00000 | |||
| foa | <- | f_famb | 1.00000 | |||
| fea | <- | f_famb | lambda | 1.10086 | 0.06836 | 16.10408 |
| rpa | <- | f_rpa | 0.83700 | |||
| riq | <- | f_riq | 0.89400 | |||
| rses | <- | f_rses | 0.94900 | |||
| fses | <- | f_fses | 0.94900 | |||
| fiq | <- | f_fiq | 0.89400 | |||
| fpa | <- | f_fpa | 0.83700 | |||
| f_ramb | <- | f_rpa | gam1 | 0.17618 | 0.03502 | 5.03081 |
| f_ramb | <- | f_riq | gam2 | 0.32351 | 0.04346 | 7.44351 |
| f_ramb | <- | f_rses | gam3 | 0.22334 | 0.03533 | 6.32150 |
| f_ramb | <- | f_fses | gam4 | 0.07698 | 0.03225 | 2.38702 |
| f_famb | <- | f_rses | gam4 | 0.07698 | 0.03225 | 2.38702 |
| f_famb | <- | f_fses | gam3 | 0.22334 | 0.03533 | 6.32150 |
| f_famb | <- | f_fiq | gam2 | 0.32351 | 0.04346 | 7.44351 |
| f_famb | <- | f_fpa | gam1 | 0.17618 | 0.03502 | 5.03081 |
| f_ramb | <- | f_famb | beta | 0.11074 | 0.04283 | 2.58539 |
| f_famb | <- | f_ramb | beta | 0.11074 | 0.04283 | 2.58539 |
| Variance Parameters | |||||
|---|---|---|---|---|---|
| Variance Type |
Variable | Parameter | Estimate | Standard Error |
t Value |
| Error | f_ramb | psi | 0.22453 | 0.02973 | 7.55201 |
| f_famb | psi | 0.22453 | 0.02973 | 7.55201 | |
| Exogenous | f_rpa | 1.00000 | |||
| f_riq | 1.00000 | ||||
| f_rses | 1.00000 | ||||
| f_fpa | 1.00000 | ||||
| f_fiq | 1.00000 | ||||
| f_fses | 1.00000 | ||||
| Error | rea | thetaea | 0.30645 | 0.03721 | 8.23647 |
| fea | thetaea | 0.30645 | 0.03721 | 8.23647 | |
| roa | thetaoa | 0.42304 | 0.03650 | 11.58877 | |
| foa | thetaoa | 0.42304 | 0.03650 | 11.58877 | |
| rpa | errpa1 | 0.30781 | 0.07510 | 4.09880 | |
| fpa | errpa2 | 0.28837 | 0.07366 | 3.91467 | |
| riq | erriq1 | 0.26748 | 0.07295 | 3.66672 | |
| fiq | erriq2 | 0.15653 | 0.06614 | 2.36682 | |
| rses | errses1 | 0.11477 | 0.07265 | 1.57975 | |
| fses | errses2 | 0.08832 | 0.07088 | 1.24608 | |
| Covariances Among Exogenous Variables | |||||
|---|---|---|---|---|---|
| Var1 | Var2 | Parameter | Estimate | Standard Error |
t Value |
| f_rpa | f_riq | cov1 | 0.26494 | 0.05436 | 4.87395 |
| f_rpa | f_rses | cov2 | 0.00185 | 0.04995 | 0.03696 |
| f_riq | f_rses | cov3 | 0.31164 | 0.05039 | 6.18460 |
| f_fpa | f_fiq | cov1 | 0.26494 | 0.05436 | 4.87395 |
| f_fpa | f_fses | cov2 | 0.00185 | 0.04995 | 0.03696 |
| f_fiq | f_fses | cov3 | 0.31164 | 0.05039 | 6.18460 |
| f_rpa | f_fpa | cov4 | 0.15828 | 0.07846 | 2.01729 |
| f_rpa | f_fiq | cov5 | 0.11895 | 0.05383 | 2.20978 |
| f_rpa | f_fses | cov6 | 0.06924 | 0.04993 | 1.38664 |
| f_riq | f_fpa | cov5 | 0.11895 | 0.05383 | 2.20978 |
| f_riq | f_fiq | cov7 | 0.43180 | 0.07084 | 6.09540 |
| f_riq | f_fses | cov8 | 0.25004 | 0.05039 | 4.96207 |
| f_rses | f_fpa | cov6 | 0.06924 | 0.04993 | 1.38664 |
| f_rses | f_fiq | cov8 | 0.25004 | 0.05039 | 4.96207 |
| f_rses | f_fses | cov9 | 0.30203 | 0.06360 | 4.74852 |
The chi-square value for testing model 5 versus model 2 is  with degree of freedom. This test statistic is insignificant. Omitting the covariance between the disturbance terms, therefore, causes hardly any deterioration in the fit of the model.
These data fail to provide evidence of direct reciprocal influence between the respondent’s and friend’s ambitions or of a covariance between the disturbance terms when these hypotheses are considered separately. Notice, however, that the covariance psi12 between the disturbance terms increases from  for model 2 to
  for model 4. Before you conclude that all of these paths can be omitted from the model, it is important to test both hypotheses together by setting both beta and psi12 to zero as in Loehlin’s (1987) model 7:
   title2 'Loehlin (1987) analysis: Model 7';
   data model7(type=calismdl);
      set model2;
      if _name_='psi12'|_name_='beta' then
         do;
            _name_=' ';
            _estim_=0;
         end;
   run;
   proc tcalis corr data=aspire nobs=329 inmodel=model7;
   run;
The fit summary is displayed in Figure 17.31, and the estimation results are displayed in Figure 17.32.
| Fit Summary | ||
|---|---|---|
| Modeling Info | N Observations | 329 |
| N Variables | 10 | |
| N Moments | 55 | |
| N Parameters | 25 | |
| N Active Constraints | 0 | |
| Independence Model Chi-Square | 872.0008 | |
| Independence Model Chi-Square DF | 45 | |
| Absolute Index | Fit Function | 0.0773 |
| Chi-Square | 25.3466 | |
| Chi-Square DF | 30 | |
| Pr > Chi-Square | 0.7080 | |
| Z-Test of Wilson & Hilferty | -0.5487 | |
| Hoelter Critical N | 568 | |
| Root Mean Square Residual (RMSR) | 0.0363 | |
| Standardized RMSR (SRMSR) | 0.0363 | |
| Goodness of Fit Index (GFI) | 0.9846 | |
| Parsimony Index | Adjusted GFI (AGFI) | 0.9718 |
| Parsimonious GFI | 0.6564 | |
| RMSEA Estimate | 0.0000 | |
| RMSEA Lower 90% Confidence Limit | . | |
| RMSEA Upper 90% Confidence Limit | 0.0326 | |
| Probability of Close Fit | 0.9975 | |
| ECVI Estimate | 0.2350 | |
| ECVI Lower 90% Confidence Limit | . | |
| ECVI Upper 90% Confidence Limit | 0.2815 | |
| Akaike Information Criterion | -34.6534 | |
| Bozdogan CAIC | -178.5351 | |
| Schwarz Bayesian Criterion | -148.5351 | |
| McDonald Centrality | 1.0071 | |
| Incremental Index | Bentler Comparative Fit Index | 1.0000 |
| Bentler-Bonett NFI | 0.9709 | |
| Bentler-Bonett Non-normed Index | 1.0084 | |
| Bollen Normed Index Rho1 | 0.9564 | |
| Bollen Non-normed Index Delta2 | 1.0055 | |
| James et al. Parsimonious NFI | 0.6473 | |
| PATH List | ||||||
|---|---|---|---|---|---|---|
| Path | Parameter | Estimate | Standard Error |
t Value | ||
| rea | <- | f_ramb | lambda | 1.10371 | 0.06784 | 16.27015 |
| roa | <- | f_ramb | 1.00000 | |||
| foa | <- | f_famb | 1.00000 | |||
| fea | <- | f_famb | lambda | 1.10371 | 0.06784 | 16.27015 |
| rpa | <- | f_rpa | 0.83700 | |||
| riq | <- | f_riq | 0.89400 | |||
| rses | <- | f_rses | 0.94900 | |||
| fses | <- | f_fses | 0.94900 | |||
| fiq | <- | f_fiq | 0.89400 | |||
| fpa | <- | f_fpa | 0.83700 | |||
| f_ramb | <- | f_rpa | gam1 | 0.17653 | 0.03604 | 4.89810 |
| f_ramb | <- | f_riq | gam2 | 0.35727 | 0.04609 | 7.75204 |
| f_ramb | <- | f_rses | gam3 | 0.24187 | 0.03628 | 6.66710 |
| f_ramb | <- | f_fses | gam4 | 0.11087 | 0.03056 | 3.62795 |
| f_famb | <- | f_rses | gam4 | 0.11087 | 0.03056 | 3.62795 |
| f_famb | <- | f_fses | gam3 | 0.24187 | 0.03628 | 6.66710 |
| f_famb | <- | f_fiq | gam2 | 0.35727 | 0.04609 | 7.75204 |
| f_famb | <- | f_fpa | gam1 | 0.17653 | 0.03604 | 4.89810 |
| f_ramb | <- | f_famb | 0 | |||
| f_famb | <- | f_ramb | 0 | |||
| Variance Parameters | |||||
|---|---|---|---|---|---|
| Variance Type |
Variable | Parameter | Estimate | Standard Error |
t Value |
| Error | f_ramb | psi | 0.21011 | 0.02940 | 7.14704 |
| f_famb | psi | 0.21011 | 0.02940 | 7.14704 | |
| Exogenous | f_rpa | 1.00000 | |||
| f_riq | 1.00000 | ||||
| f_rses | 1.00000 | ||||
| f_fpa | 1.00000 | ||||
| f_fiq | 1.00000 | ||||
| f_fses | 1.00000 | ||||
| Error | rea | thetaea | 0.31633 | 0.03648 | 8.67106 |
| fea | thetaea | 0.31633 | 0.03648 | 8.67106 | |
| roa | thetaoa | 0.42656 | 0.03610 | 11.81508 | |
| foa | thetaoa | 0.42656 | 0.03610 | 11.81508 | |
| rpa | errpa1 | 0.31329 | 0.07538 | 4.15589 | |
| fpa | errpa2 | 0.29286 | 0.07389 | 3.96366 | |
| riq | erriq1 | 0.30776 | 0.07307 | 4.21157 | |
| fiq | erriq2 | 0.19193 | 0.06613 | 2.90250 | |
| rses | errses1 | 0.14303 | 0.07313 | 1.95574 | |
| fses | errses2 | 0.11804 | 0.07147 | 1.65171 | |
| Covariances Among Exogenous Variables | |||||
|---|---|---|---|---|---|
| Var1 | Var2 | Parameter | Estimate | Standard Error |
t Value |
| f_rpa | f_riq | cov1 | 0.27533 | 0.05552 | 4.95900 |
| f_rpa | f_rses | cov2 | 0.00611 | 0.05085 | 0.12020 |
| f_riq | f_rses | cov3 | 0.33510 | 0.05150 | 6.50648 |
| f_fpa | f_fiq | cov1 | 0.27533 | 0.05552 | 4.95900 |
| f_fpa | f_fses | cov2 | 0.00611 | 0.05085 | 0.12020 |
| f_fiq | f_fses | cov3 | 0.33510 | 0.05150 | 6.50648 |
| f_rpa | f_fpa | cov4 | 0.17099 | 0.07872 | 2.17210 |
| f_rpa | f_fiq | cov5 | 0.13859 | 0.05431 | 2.55174 |
| f_rpa | f_fses | cov6 | 0.07563 | 0.05077 | 1.48956 |
| f_riq | f_fpa | cov5 | 0.13859 | 0.05431 | 2.55174 |
| f_riq | f_fiq | cov7 | 0.48105 | 0.06993 | 6.87858 |
| f_riq | f_fses | cov8 | 0.27235 | 0.05157 | 5.28154 |
| f_rses | f_fpa | cov6 | 0.07563 | 0.05077 | 1.48956 |
| f_rses | f_fiq | cov8 | 0.27235 | 0.05157 | 5.28154 |
| f_rses | f_fses | cov9 | 0.32046 | 0.06517 | 4.91719 |
When model 7 is tested against models 2, 4, and 5, the p-values are respectively 0.0433, 0.0370, and 0.0123, indicating that the combined effect of the reciprocal influence and the covariance of the disturbance terms is statistically significant. Thus, the hypothesis tests indicate that it is acceptable to omit either the reciprocal influences or the covariance of the disturbances, but not both.
It is also of interest to test the covariances between the error terms for educational (covea) and occupational aspiration (covoa), since these terms are omitted from Jöreskog and Sörbom’s (1988) models. Constraining covea and covoa to zero produces Loehlin’s (1987) model 6:
   title2 'Loehlin (1987) analysis: Model 6';
   data model6(type=calismdl);
      set model2;
      if _name_='covea'|_name_='covoa' then
         do;
            _name_=' ';
            _estim_=0;
         end;
   run;
   proc tcalis corr data=aspire nobs=329 inmodel=model6;
   run;
The fit summary is displayed in Figure 17.33.
| Fit Summary | ||
|---|---|---|
| Modeling Info | N Observations | 329 |
| N Variables | 10 | |
| N Moments | 55 | |
| N Parameters | 25 | |
| N Active Constraints | 0 | |
| Independence Model Chi-Square | 872.0008 | |
| Independence Model Chi-Square DF | 45 | |
| Absolute Index | Fit Function | 0.1020 |
| Chi-Square | 33.4475 | |
| Chi-Square DF | 30 | |
| Pr > Chi-Square | 0.3035 | |
| Z-Test of Wilson & Hilferty | 0.5151 | |
| Hoelter Critical N | 431 | |
| Root Mean Square Residual (RMSR) | 0.0306 | |
| Standardized RMSR (SRMSR) | 0.0306 | |
| Goodness of Fit Index (GFI) | 0.9802 | |
| Parsimony Index | Adjusted GFI (AGFI) | 0.9638 |
| Parsimonious GFI | 0.6535 | |
| RMSEA Estimate | 0.0187 | |
| RMSEA Lower 90% Confidence Limit | . | |
| RMSEA Upper 90% Confidence Limit | 0.0471 | |
| Probability of Close Fit | 0.9686 | |
| ECVI Estimate | 0.2597 | |
| ECVI Lower 90% Confidence Limit | . | |
| ECVI Upper 90% Confidence Limit | 0.3164 | |
| Akaike Information Criterion | -26.5525 | |
| Bozdogan CAIC | -170.4342 | |
| Schwarz Bayesian Criterion | -140.4342 | |
| McDonald Centrality | 0.9948 | |
| Incremental Index | Bentler Comparative Fit Index | 0.9958 |
| Bentler-Bonett NFI | 0.9616 | |
| Bentler-Bonett Non-normed Index | 0.9937 | |
| Bollen Normed Index Rho1 | 0.9425 | |
| Bollen Non-normed Index Delta2 | 0.9959 | |
| James et al. Parsimonious NFI | 0.6411 | |
The chi-square value for testing model 6 versus model 2 is  with degrees of freedom and a p-value of
  , indicating that there is considerable evidence of correlation between the error terms.
The following table summarizes the results from Loehlin’s (1987) seven models.
Model |
|
df |
p-value |
SBC |
|---|---|---|---|---|
1. Full model |
|
|
|
|
2. Equality constraints |
|
|
|
|
3. No SES path |
|
|
|
|
4. No reciprocal influence |
|
|
|
|
5. No disturbance correlation |
|
|
|
|
6. No error correlation |
|
|
|
|
7. Constraints from both 4 and 5 |
|
|
|
|


For comparing models, you can use a DATA step to compute the differences of the chi-square statistics and p-values:
   data _null_;
      array achisq[7] _temporary_
         (12.0132 19.0697 23.0365 20.9981 19.0745 33.4475 25.3466);
      array adf[7] _temporary_
         (13 28 29 29 29 30 30);
      retain indent 16;
      file print;
      input ho ha @@;
      chisq = achisq[ho] - achisq[ha];
      df = adf[ho] - adf[ha];
      p = 1 - probchi( chisq, df);
      if _n_ = 1 then put
         / +indent 'model comparison   chi**2   df  p-value'
         / +indent '---------------------------------------';
      put +indent +3 ho ' versus ' ha @18 +indent chisq 8.4 df 5. p 9.4;
   datalines;
   2 1    3 2    4 2    5 2    7 2    7 4    7 5    6 2
   ;
The DATA step displays the table in Figure 17.34.
Although none of the seven models can be rejected when tested against the alternative of an unrestricted covariance matrix, the model comparisons make it clear that there are important differences among the models. Schwarz’s Bayesian criterion indicates model 5 as the model of choice. The constraints added to model 5 in model 7 can be rejected (p=0.0123), while model 5 cannot be rejected when tested against the less constrained model 2 (p=0.9448). Hence, among the small number of models considered, model 5 has strong statistical support. However, as Loehlin (1987, p. 106) points out, many other models for these data could be constructed. Further analysis should consider, in addition to simple modifications of the models, the possibility that more than one friend could influence a boy’s aspirations, and that a boy’s ambition might have some effect on his choice of friends. Pursuing such theories would be statistically challenging.
Copyright © 2009 by SAS Institute Inc., Cary, NC, USA. All rights reserved.