| The CLUSTER Procedure |
Example 29.4 Evaluating the Effects of Ties
If, at some level of the cluster history, there is a tie for minimum distance between clusters, then one or more levels of the sample cluster tree are not uniquely determined. This example shows how the degree of indeterminacy can be assessed.
Mammals have four kinds of teeth: incisors, canines, premolars, and molars. The following data set gives the number of teeth of each kind on one side of the top and bottom jaws for 32 mammals.
Since all eight variables are measured in the same units, it is not strictly necessary to rescale the data. However, the canines have much less variance than the other kinds of teeth and, therefore, have little effect on the analysis if the variables are not standardized. An average linkage cluster analysis is run with and without standardization to enable comparison of the results.
   title 'Hierarchical Cluster Analysis of Mammals'' Teeth Data';
   title2 'Evaluating the Effects of Ties';
   data teeth;
      input mammal $ 1-16
            @21 (v1-v8) (1.);
      label v1='Top incisors'
            v2='Bottom incisors'
            v3='Top canines'
            v4='Bottom canines'
            v5='Top premolars'
            v6='Bottom premolars'
            v7='Top molars'
            v8='Bottom molars';
      datalines;
   BROWN BAT           23113333
   MOLE                32103333
   SILVER HAIR BAT     23112333
   PIGMY BAT           23112233
   HOUSE BAT           23111233
   RED BAT             13112233
   PIKA                21002233
   RABBIT              21003233
   BEAVER              11002133
   GROUNDHOG           11002133
   GRAY SQUIRREL       11001133
   HOUSE MOUSE         11000033
   PORCUPINE           11001133
   WOLF                33114423
   BEAR                33114423
   RACCOON             33114432
   MARTEN              33114412
   WEASEL              33113312
   WOLVERINE           33114412
   BADGER              33113312
   RIVER OTTER         33114312
   SEA OTTER           32113312
   JAGUAR              33113211
   COUGAR              33113211
   FUR SEAL            32114411
   SEA LION            32114411
   GREY SEAL           32113322
   ELEPHANT SEAL       21114411
   REINDEER            04103333
   ELK                 04103333
   DEER                04003333
   MOOSE               04003333
   ;
The following statements produce Output 29.4.1:
   title3 'Raw Data';
   proc cluster data=teeth method=average nonorm noeigen;
      var v1-v8;
      id mammal;
   run;
| Root-Mean-Square Total-Sample Standard Deviation | 0.898027 |
|---|
| Cluster History | |||||
|---|---|---|---|---|---|
| NCL | Clusters Joined | FREQ | RMS Dist |
T i e |
|
| 31 | BEAVER | GROUNDHOG | 2 | 0 | T |
| 30 | GRAY SQUIRREL | PORCUPINE | 2 | 0 | T |
| 29 | WOLF | BEAR | 2 | 0 | T |
| 28 | MARTEN | WOLVERINE | 2 | 0 | T |
| 27 | WEASEL | BADGER | 2 | 0 | T |
| 26 | JAGUAR | COUGAR | 2 | 0 | T |
| 25 | FUR SEAL | SEA LION | 2 | 0 | T |
| 24 | REINDEER | ELK | 2 | 0 | T |
| 23 | DEER | MOOSE | 2 | 0 | |
| 22 | BROWN BAT | SILVER HAIR BAT | 2 | 1 | T |
| 21 | PIGMY BAT | HOUSE BAT | 2 | 1 | T |
| 20 | PIKA | RABBIT | 2 | 1 | T |
| 19 | CL31 | CL30 | 4 | 1 | T |
| 18 | CL28 | RIVER OTTER | 3 | 1 | T |
| 17 | CL27 | SEA OTTER | 3 | 1 | T |
| 16 | CL24 | CL23 | 4 | 1 | |
| 15 | CL21 | RED BAT | 3 | 1.2247 | |
| 14 | CL17 | GREY SEAL | 4 | 1.291 | |
| 13 | CL29 | RACCOON | 3 | 1.4142 | T |
| 12 | CL25 | ELEPHANT SEAL | 3 | 1.4142 | |
| 11 | CL18 | CL14 | 7 | 1.5546 | |
| 10 | CL22 | CL15 | 5 | 1.5811 | |
| 9 | CL20 | CL19 | 6 | 1.8708 | T |
| 8 | CL11 | CL26 | 9 | 1.9272 | |
| 7 | CL8 | CL12 | 12 | 2.2278 | |
| 6 | MOLE | CL13 | 4 | 2.2361 | |
| 5 | CL9 | HOUSE MOUSE | 7 | 2.4833 | |
| 4 | CL6 | CL7 | 16 | 2.5658 | |
| 3 | CL10 | CL16 | 9 | 2.8107 | |
| 2 | CL3 | CL5 | 16 | 3.7054 | |
| 1 | CL2 | CL4 | 32 | 4.2939 | |
The following statements produce Output 29.4.2:
   title3 'Standardized Data';
   proc cluster data=teeth std method=average nonorm noeigen;
      var v1-v8;
      id mammal;
   run;
| Root-Mean-Square Total-Sample Standard Deviation | 1 |
|---|
| Cluster History | |||||
|---|---|---|---|---|---|
| NCL | Clusters Joined | FREQ | RMS Dist |
T i e |
|
| 31 | BEAVER | GROUNDHOG | 2 | 0 | T |
| 30 | GRAY SQUIRREL | PORCUPINE | 2 | 0 | T |
| 29 | WOLF | BEAR | 2 | 0 | T |
| 28 | MARTEN | WOLVERINE | 2 | 0 | T |
| 27 | WEASEL | BADGER | 2 | 0 | T |
| 26 | JAGUAR | COUGAR | 2 | 0 | T |
| 25 | FUR SEAL | SEA LION | 2 | 0 | T |
| 24 | REINDEER | ELK | 2 | 0 | T |
| 23 | DEER | MOOSE | 2 | 0 | |
| 22 | PIGMY BAT | RED BAT | 2 | 0.9157 | |
| 21 | CL28 | RIVER OTTER | 3 | 0.9169 | |
| 20 | CL31 | CL30 | 4 | 0.9428 | T |
| 19 | BROWN BAT | SILVER HAIR BAT | 2 | 0.9428 | T |
| 18 | PIKA | RABBIT | 2 | 0.9428 | |
| 17 | CL27 | SEA OTTER | 3 | 0.9847 | |
| 16 | CL22 | HOUSE BAT | 3 | 1.1437 | |
| 15 | CL21 | CL17 | 6 | 1.3314 | |
| 14 | CL25 | ELEPHANT SEAL | 3 | 1.3447 | |
| 13 | CL19 | CL16 | 5 | 1.4688 | |
| 12 | CL15 | GREY SEAL | 7 | 1.6314 | |
| 11 | CL29 | RACCOON | 3 | 1.692 | |
| 10 | CL18 | CL20 | 6 | 1.7357 | |
| 9 | CL12 | CL26 | 9 | 2.0285 | |
| 8 | CL24 | CL23 | 4 | 2.1891 | |
| 7 | CL9 | CL14 | 12 | 2.2674 | |
| 6 | CL10 | HOUSE MOUSE | 7 | 2.317 | |
| 5 | CL11 | CL7 | 15 | 2.6484 | |
| 4 | CL13 | MOLE | 6 | 2.8624 | |
| 3 | CL4 | CL8 | 10 | 3.5194 | |
| 2 | CL3 | CL6 | 17 | 4.1265 | |
| 1 | CL2 | CL5 | 32 | 4.7753 | |
There are ties at 16 levels for the raw data but at only 10 levels for the standardized data. There are more ties for the raw data because the increments between successive values are the same for all of the raw variables but different for the standardized variables.
One way to assess the importance of the ties in the analysis is to repeat the analysis on several random permutations of the observations and then to see to what extent the results are consistent at the interesting levels of the cluster history. Three macros are presented to facilitate this process, as follows.
   /* --------------------------------------------------------- */
   /*                                                           */
   /* The macro CLUSPERM randomly permutes observations and     */
   /* does a cluster analysis for each permutation.             */
   /* The arguments are as follows:                             */
   /*                                                           */
   /*    data    data set name                                  */
   /*    var     list of variables to cluster                   */
   /*    id      id variable for proc cluster                   */
   /*    method  clustering method (and possibly other options) */
   /*    nperm   number of random permutations.                 */
   /*                                                           */
   /* --------------------------------------------------------- */
   %macro CLUSPERM(data,var,id,method,nperm);

      /* ------CREATE TEMPORARY DATA SET WITH RANDOM NUMBERS------ */
      data _temp_;
         set &data;
         array _random_ _ran_1-_ran_&nperm;
         do over _random_;
           _random_=ranuni(835297461);
         end;
      run;

      /* ------PERMUTE AND CLUSTER THE DATA----------------------- */
      %do n=1 %to &nperm;
          proc sort data=_temp_(keep=_ran_&n &var &id) out=_perm_;
             by _ran_&n;
          run;
          proc cluster method=&method noprint outtree=_tree_&n;
             var &var;
             id &id;
          run;
      %end;
   %mend;
   /* --------------------------------------------------------- */
   /*                                                           */
   /* The macro PLOTPERM plots various cluster statistics       */
   /* against the number of clusters for each permutation.      */
   /* The arguments are as follows:                             */
   /*                                                           */
   /*    nclus   maximum number of clusters to be plotted       */
   /*    nperm   number of random permutations.                 */
   /*                                                           */
   /* --------------------------------------------------------- */
   %macro PLOTPERM(nclus,nperm);

      /* ---CONCATENATE TREE DATA SETS FOR 20 OR FEWER CLUSTERS--- */
      data _plot_;
         set %do n=1 %to &nperm; _tree_&n(in=_in_&n) %end; ;
         if _ncl_<=&nclus;
         %do n=1 %to &nperm;
            if _in_&n then _perm_=&n;
         %end;
         label _perm_='permutation number';
         keep _ncl_ _psf_ _pst2_ _ccc_ _perm_;
      run;

      /* ---PLOT THE REQUESTED STATISTICS BY NUMBER OF CLUSTERS--- */
      proc sgscatter ;
         compare y=(_ccc_ _psf_ _pst2_) x=_ncl_ /group=_perm_ ;
      run;
   %mend;
   /* --------------------------------------------------------- */
   /*                                                           */
   /* The macro TABPERM generates cluster-membership variables */
   /* for a specified number of clusters for each permutation.  */
   /* PROC TABULATE gives the frequencies and means.            */
   /* The arguments are as follows:                             */
   /*                                                           */
   /*    var     list of variables to cluster                   */
   /*            (no "-" or ":" allowed)                        */
   /*    id      id variable for proc cluster                   */
   /*    meanfmt format for printing means in PROC TABULATE     */
   /*    nclus   number of clusters desired                     */
   /*    nperm   number of random permutations.                 */
   /*                                                           */
   /* --------------------------------------------------------- */
   %macro TABPERM(var,id,meanfmt,nclus,nperm);

      /* ------CREATE DATA SETS GIVING CLUSTER MEMBERSHIP--------- */
      %do n=1 %to &nperm;
         proc tree data=_tree_&n noprint n=&nclus
                   out=_out_&n(drop=clusname
                                 rename=(cluster=_clus_&n));
            copy &var;
            id &id;
         run;
         proc sort;
            by &id &var;
         run;
      %end;

      /* ------MERGE THE CLUSTER VARIABLES------------------------ */
      data _merge_;
         merge
            %do n=1 %to &nperm;
               _out_&n
            %end; ;
         by &id &var;
         length all_clus $ %eval(3*&nperm);
         %do n=1 %to &nperm;
            substr( all_clus, %eval(1+(&n-1)*3), 3) =
               put( _clus_&n, 3.);
         %end;
      run;

      /* ------ TABULATE CLUSTER COMBINATIONS------------ */
      proc sort;
         by _clus_:;
      run;
      proc tabulate order=data formchar='           ';
         class all_clus;
         var &var;
         table all_clus, n='FREQ'*f=5. mean*f=&meanfmt*(&var) /
            rts=%eval(&nperm*3+1);
      run;
   %mend;
To use these macros, it is first convenient to define a macro, VLIST, listing the teeth variables, since the forms V1-V8 or V: cannot be used with the TABULATE procedure in the TABPERM macro:
   /* -TABULATE does not accept hyphens or colons in VAR lists- */
   %let vlist=v1 v2 v3 v4 v5 v6 v7 v8;
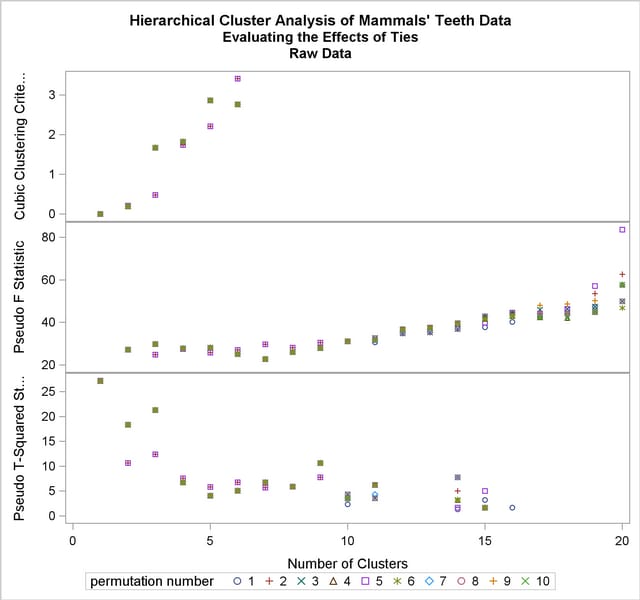
The CLUSPERM macro is then called to analyze 10 random permutations. The PLOTPERM macro plots the pseudo  and
and  statistics and the cubic clustering criterion. Since the data are discrete, the pseudo statistic and the cubic clustering criterion can be expected to increase as the number of clusters increases, so local maxima or large jumps in these statistics are more relevant than the global maximum in determining the number of clusters. For the raw data, only the pseudo statistic indicates the possible presence of clusters, with the 4-cluster level being suggested. Hence, the macros are used as follows to analyze the results at the 4-cluster level:
   title3 'Raw Data';

   /* ------CLUSTER RAW DATA WITH AVERAGE LINKAGE-------------- */
   %clusperm( teeth, &vlist, mammal, average, 10);
The following statements produce Output 29.4.3.
   /* -----PLOT STATISTICS FOR THE LAST 20 LEVELS-------------- */
   %plotperm(20, 10);
The following statements produce Output 29.4.4.
   /* ------ANALYZE THE 4-CLUSTER LEVEL------------------------ */
   %tabperm( &vlist, mammal, 9.1, 4, 10);
| Hierarchical Cluster Analysis of Mammals' Teeth Data |
| Evaluating the Effects of Ties |
| Raw Data |
| FREQ | Mean | ||||||||
|---|---|---|---|---|---|---|---|---|---|
| Top incisors | Bottom incisors | Top canines | Bottom canines | Top premolars | Bottom premolars | Top molars | Bottom molars | ||
| all_clus | 4 | 0.0 | 4.0 | 0.5 | 0.0 | 3.0 | 3.0 | 3.0 | 3.0 |
| 1 3 1 1 1 3 3 3 2 3 | |||||||||
| 2 2 2 2 2 2 1 2 1 1 | 15 | 2.9 | 2.6 | 1.0 | 1.0 | 3.6 | 3.4 | 1.3 | 1.8 |
| 2 4 2 2 4 2 1 2 1 1 | 1 | 3.0 | 2.0 | 1.0 | 0.0 | 3.0 | 3.0 | 3.0 | 3.0 |
| 3 1 3 3 3 1 2 1 3 2 | 5 | 1.0 | 1.0 | 0.0 | 0.0 | 1.2 | 0.8 | 3.0 | 3.0 |
| 3 4 3 3 4 1 2 1 3 2 | 2 | 2.0 | 1.0 | 0.0 | 0.0 | 2.5 | 2.0 | 3.0 | 3.0 |
| 4 4 4 4 4 4 4 4 4 4 | 5 | 1.8 | 3.0 | 1.0 | 1.0 | 2.0 | 2.4 | 3.0 | 3.0 |
From the TABULATE output, you can see that two types of clustering are obtained. In one case, the mole is grouped with the carnivores, while the pika and rabbit are grouped with the rodents. In the other case, both the mole and the lagomorphs are grouped with the bats.
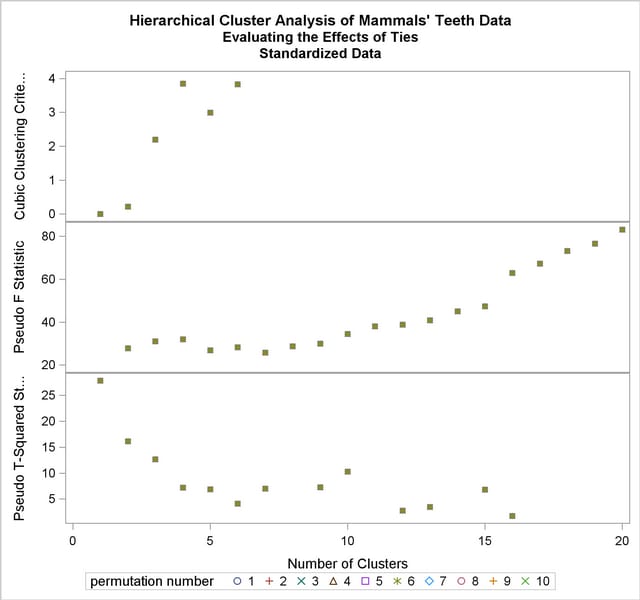
Next, the analysis is repeated with the standardized data as shown in the following statements. The pseudo and statistics indicate 3 or 4 clusters, while the cubic clustering criterion shows a sharp rise up to 4 clusters and then levels off up to 6 clusters. So the TABPERM macro is used again at the 4-cluster level. In this case, there is no indeterminacy, because the same four clusters are obtained with every permutation, although in different orders. It must be emphasized, however, that lack of indeterminacy in no way indicates validity.
   title3 'Standardized Data';

   /*------CLUSTER STANDARDIZED DATA WITH AVERAGE LINKAGE------*/
   %clusperm( teeth, &vlist, mammal, average std, 10);
The following statements produce Output 29.4.5.
   /* -----PLOT STATISTICS FOR THE LAST 20 LEVELS-------------- */
   %plotperm(20, 10);
The following statements produce Output 29.4.6.
   /* ------ANALYZE THE 4-CLUSTER LEVEL------------------------ */
   %tabperm( &vlist, mammal, 9.1, 4, 10);
| Hierarchical Cluster Analysis of Mammals' Teeth Data |
| Evaluating the Effects of Ties |
| Standardized Data |
| FREQ | Mean | ||||||||
|---|---|---|---|---|---|---|---|---|---|
| Top incisors | Bottom incisors | Top canines | Bottom canines | Top premolars | Bottom premolars | Top molars | Bottom molars | ||
| all_clus | 4 | 0.0 | 4.0 | 0.5 | 0.0 | 3.0 | 3.0 | 3.0 | 3.0 |
| 1 3 1 1 1 3 3 3 2 3 | |||||||||
| 2 2 2 2 2 2 1 2 1 1 | 15 | 2.9 | 2.6 | 1.0 | 1.0 | 3.6 | 3.4 | 1.3 | 1.8 |
| 3 1 3 3 3 1 2 1 3 2 | 7 | 1.3 | 1.0 | 0.0 | 0.0 | 1.6 | 1.1 | 3.0 | 3.0 |
| 4 4 4 4 4 4 4 4 4 4 | 6 | 2.0 | 2.8 | 1.0 | 0.8 | 2.2 | 2.5 | 3.0 | 3.0 |
Copyright © 2009 by SAS Institute Inc., Cary, NC, USA. All rights reserved.