|
|
Example 25.4 Linear Relations among Factor Loadings
In this example, a confirmatory factor-analysis model with linear constraints on loadings is specified by the COSAN statement. SAS programming statements are used to set the constraints. In the context of the current example, the differences between fitting covariance structures and correlation structures will also be discussed.
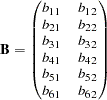
The correlation matrix of six variables from Kinzer and Kinzer (N=326) is used by Guttman (1957) as an example that yields an approximate simplex. McDonald (1980) uses this data set as an example of factor analysis where he supposes that the loadings of the second factor are linear functions of the loadings on the first factor. Let  be the factor loading matrix containing the two factors and six variables so that
and
The correlation structures are represented by
where  represents the diagonal matrix of unique variances for the variables.
With parameters  and
and  being unconstrained, McDonald (1980) has fitted an underidentified model with seven degrees of freedom. Browne (1982) imposes the following identification condition:
In this example, Browne’s identification condition is imposed. The following statements specify the confirmatory factor model:
   Data Kinzer(TYPE=CORR);
   Title "Data Matrix of Kinzer & Kinzer, see GUTTMAN (1957)";
      _TYPE_ = 'CORR'; INPUT _NAME_ $ var1-var6;
      Datalines;
   var1  1.00   .     .     .     .     .
   var2   .51  1.00   .     .     .     .
   var3   .46   .51  1.00   .     .     .
   var4   .46   .47   .54  1.00   .     .
   var5   .40   .39   .49   .57  1.00   .
   var6   .33   .39   .47   .45   .56  1.00
     ;
   proc calis data=Kinzer method=max nobs=326 nose;
      cosan B(2,Gen) * I(2,Ide) + U(6,Ide) * PSI(6,DIA);
      matrix B
             [ ,1]= b11 b21 b31 b41 b51 b61,
             [ ,2]= b12 b22 b32 b42 b52 b62;
      matrix Psi
             [1,1]= psi1-psi6;
      parameters alpha = .5;
      /* SAS Programming Statements */
      b12  = alpha - b11;
      b22  = alpha - b21;
      b32  = alpha - b31;
      b42  = alpha - b41;
      b52  = alpha - b51;
      b62  = alpha - b61;
      vnames B  Fact1 Fact2,
             I  Fact1 Fact2,
             U  var1-var6,
             PSI var1-var6;
   run;
In the COSAN statement, you specify the model matrices for the correlation structures. Matrix is the  factor loading matrix. Matrix
  is a fixed
  identity matrix, representing the factor variances and covariances. In the next term, matrix
  is a
is a  identity matrix, appearing there only because it makes the specification conform to the format of the generalized COSAN model. The PSI matrix is the matrix for variances and covariances for errors. The matrix specification in the COSAN statement realizes the following matrix model:
which is the intended correlation structures.
In the MATRIX statements, parameters are defined. The loading parameters are all specified with prefix "b" and are located in the matrix. Error variances are all specified with prefix "psi" and are located in the PSI matrix. In this model, all manifest variables have nonzero loadings on the two factors. These loading parameters are specified after the equal signs and are named with the prefix "b".
An additional parameter alpha is specified in the PARAMETERS statement with an initial value of 0.5. Then, six SAS programming statements are used to define the loadings on the second factor as functions of the loadings on the first factor.
Finally, the VNAMES statement is used to name the columns of the model matrices.
In the specification, there are 12 loadings in matrix and six unique variances in matrix PSI. Adding the parameter alpha in the list, there are 19 parameters in total. However, the loading parameters are not all independent of each other. As defined in the SAS programming statements, six loadings are dependent. This reduces the number of free parameters to 13. Hence the degrees of freedom for the model is  .
.
In Output 25.4.1, a fit summary table is shown. The chi-square test statistic of model fit is 10.337 with  =8 (
=8 ( = 0.242). This indicates a good fit.
Output 25.4.1
Fit of the Correlation Structures
The CALIS Procedure
Covariance Structure Analysis: Maximum Likelihood Estimation
| 0.0318 |
| 0.9897 |
| 0.9730 |
| 0.0409 |
| 0.0409 |
| 0.5278 |
| 10.3374 |
| 8 |
| 0.2421 |
| 682.87 |
| 15 |
| 0.0300 |
| . |
| 0.0756 |
| 0.1136 |
| . |
| 0.1525 |
| 0.7137 |
| 0.9965 |
| 10.1441 |
| -5.6626 |
| -43.9578 |
| -35.9578 |
| 0.9964 |
| 0.9934 |
| 0.9849 |
| 0.5253 |
| 0.7019 |
| 0.9716 |
| 0.9965 |
| 489 |
The estimated factor loading matrix and error covariance matrix are presented in Output 25.4.2. The estimates for alpha and other dependent parameters are presented in Output 25.4.3.
Output 25.4.2
Estimates
The CALIS Procedure
Covariance Structure Analysis: Maximum Likelihood Estimation
The CALIS Procedure
Covariance Structure Analysis: Maximum Likelihood Estimation
Estimated Parameter Matrix U[6:6]
Identity Matrix
Constant Model Matrix
Output 25.4.3
Additional Parameter
| 0.97825 |
| 0.61736 |
| 0.65709 |
| 0.49234 |
| 0.40378 |
| 0.17973 |
| 0.30462 |
All these estimates are essentially the same as reported in Browne (1982). Notice that there are no standard error estimates in the output, as requested by the NOSE option in the PROC CALIS statement. Standard error estimates are not of interest in the current example.
Fitting the Correct Correlation Structures
In specifying the previous factor model by using COSAN, covariance structures rather than the correlation structures have been incorrectly assumed. That is, when fitting the correlation structures, the diagonal elements of  must always be fixed ones. But these fixed ones have not been handled properly in the previous code, resulting in a specification of covariance structures rather than correlation structures. To fix the problem, additional model constraints on the diagonal elements of the correlation structures represented by
  are required. For example, it can be done by constraining the error variances
| |
 |
|
|
Other constraints could also serve the same purpose, but these are the most convenient and therefore are used subsequently. Without setting up these constraints, the previous PROC CALIS run is analyzing covariance structures. As pointed out in Browne (1982), fitting such covariance structures directly is not entirely appropriate for analyzing correlations. For the current data example, according to Browne (1982), the estimates obtained from fitting the wrong covariance structure model are still consistent (as if they were estimating the population parameters in the correlation structures). However, the chi-square test statistic as reported in the preceding section is not correct.
In addition, due to the fact that discrepancy functions used in PROC CALIS are derived for covariance matrices rather than correlation matrices, PROC CALIS is essentially set up for analyzing covariance structures (with or without mean structures), but not correlation structures. Hence, the statistical theory behind PROC CALIS applies to covariance structure analysis, but might not generalize to correlation structure analysis. Despite that, can PROC CALIS somehow fit the correct correlation structures to the current data without compromising the statistical theory? The answer is yes.
First, recall that the correlation structures are represented by:
As before, in the matrix, there are six linear constraints on the factor loadings. In addition, the diagonal elements of must be ones. To analyze the correlation structures by using PROC CALIS, a covariance structure model with such correlation structures embedded is now specified. That is, the covariance structure to be fitted by PROC CALIS is:
where  is a diagonal matrix containing the population standard deviations for the manifest variables. This form of covariance structures implies the specification of the following COSAN model:
   proc calis data=Kinzer method=max nobs=326 nose;
      cosan D(6,DIA) * B(2,Gen) * I(2,Ide) + D(6,DIA) * PSI(6,DIA);
      matrix B
             [ ,1]= b11 b21 b31 b41 b51 b61,
             [ ,2]= b12 b22 b32 b42 b52 b62;
      matrix Psi
             [1,1]= psi1-psi6;
      matrix D
             [1,1]= d1-d6 (6 * 1.);
      parameters alpha (1.);
      /* SAS Programming Statements */
      /* 12 Constraints on Correlation structures */
      b12  = alpha - b11;
      b22  = alpha - b21;
      b32  = alpha - b31;
      b42  = alpha - b41;
      b52  = alpha - b51;
      b62  = alpha - b61;
      psi1 = 1. - b11 * b11 - b12 * b12;
      psi2 = 1. - b21 * b21 - b22 * b22;
      psi3 = 1. - b31 * b31 - b32 * b32;
      psi4 = 1. - b41 * b41 - b42 * b42;
      psi5 = 1. - b51 * b51 - b52 * b52;
      psi6 = 1. - b61 * b61 - b62 * b62;
      vnames D  var1-var6,
             B  Fact1 Fact2,
             I  Fact1 Fact2,
             Psi var1-var6;
   run;
In the COSAN statement, the covariance structures are described in the form of the generalized COSAN model. The most significant change is the inclusion of matrix for the population standard deviations. Accompanying this change is the addition of a MATRIX statement for defining the error variance parameters in matrix . Also, in this new specification, Psi1-Psi6 are defined as functions of the loading parameters:
This ensures that the correlation structures will have fixed ones for the diagonal elements.
Other constraints remain the same way as defined in the previous run. For example, the loadings on the second factor are functions of the loadings on the first factor:
The fit summary is presented in Output 25.4.4. The chi-square test statistic is 14.63 with =8 ( = 0.067). This shows that the previous chi-square test based on fitting a wrong covariance structure model is indeed questionable.
Output 25.4.4
Model Fit of the Correlation Structures
The CALIS Procedure
Covariance Structure Analysis: Maximum Likelihood Estimation
| 0.0450 |
| 0.9849 |
| 0.9604 |
| 0.0378 |
| 0.0378 |
| 0.5253 |
| 14.6269 |
| 8 |
| 0.0668 |
| 682.87 |
| 15 |
| 0.0505 |
| . |
| 0.0908 |
| 0.1268 |
| . |
| 0.1729 |
| 0.4382 |
| 0.9901 |
| 14.9199 |
| -1.3731 |
| -39.6683 |
| -31.6683 |
| 0.9899 |
| 0.9814 |
| 0.9786 |
| 0.5219 |
| 1.5034 |
| 0.9598 |
| 0.9902 |
| 346 |
Estimates of the loadings, population standard deviations, error variances, and the alpha parameter are presented in Output 25.4.5 and Output 25.4.6.
Output 25.4.5
Estimates of Loadings and Standard Deviations
Output 25.4.6
Estimates of Error Variances and Alpha
| 0.97400 |
| 0.63184 |
| 0.65305 |
| 0.48222 |
| 0.39849 |
| 0.19715 |
| 0.30741 |
| 0.48370 |
| 0.47051 |
| 0.52561 |
| 0.50999 |
| 0.35763 |
| 0.46115 |
Except for the population standard deviation parameter d’s, all other parameters estimated in the current model can be compared with those from the previous fitting of an incorrect covariance structure model. Although estimates in the current model do not differ very much from those in the previous analysis, it is assuring that they are obtained from fitting a correctly specified covariance structure model with the intended correlation structures embedded.
Copyright
© 2009 by SAS Institute Inc., Cary, NC, USA. All
rights reserved.