| The BOXPLOT Procedure |
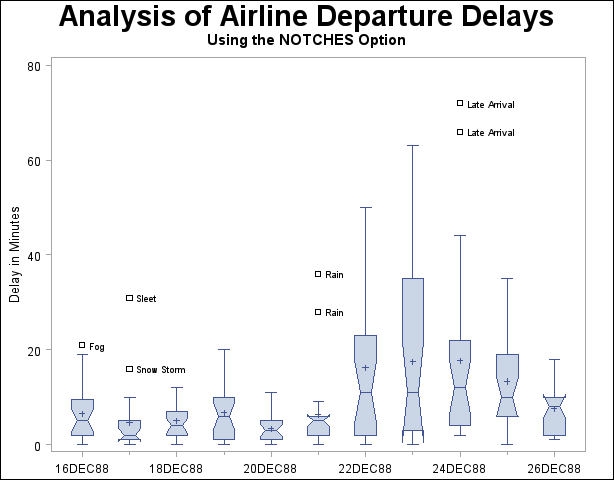
Example 24.4 Creating Notched Box-and-Whiskers Plots
The following statements use the flight delay data of Example 24.1 to create box-and-whiskers plots with notches:
   title 'Analysis of Airline Departure Delays';
   title2 'Using the NOTCHES Option';
   proc boxplot data=Times;
      plot Delay*Day /
         boxstyle = schematicid
         nohlabel
         notches;
      id Reason;
      label Delay = 'Delay in Minutes';
   run;
The notches, requested with the NOTCHES option, measure the significance of the difference between two medians. The medians of two box plots are significantly different at approximately the 0.95 confidence level if the corresponding notches do not overlap. For example, in Output 24.4.1, the median for December 20 is significantly different from the median for December 24.
Output 24.4.1
Notched Side-by-Side Box-and-Whiskers Plots
Copyright © 2009 by SAS Institute Inc., Cary, NC, USA. All rights reserved.