| The BOXPLOT Procedure |
| Creating Box Plots from Raw Data |
A petroleum company uses a turbine to heat water into steam that is pumped into the ground to make oil less viscous and easier to extract. This process occurs 20 times daily, and the amount of power (in kilowatts) used to heat the water to the desired temperature is recorded. The following statements create a SAS data set called Turbine that contains the power output measurements for 10 nonconsecutive days:
   data Turbine;
      informat Day date7.;
      format Day date5.;
      label KWatts='Average Power Output';
      input Day @;
      do i=1 to 10;
         input KWatts @;
         output;
         end;
      drop i;
      datalines;
   05JUL94 3196 3507 4050 3215 3583 3617 3789 3180 3505 3454
   05JUL94 3417 3199 3613 3384 3475 3316 3556 3607 3364 3721
   06JUL94 3390 3562 3413 3193 3635 3179 3348 3199 3413 3562
   06JUL94 3428 3320 3745 3426 3849 3256 3841 3575 3752 3347
   07JUL94 3478 3465 3445 3383 3684 3304 3398 3578 3348 3369
   07JUL94 3670 3614 3307 3595 3448 3304 3385 3499 3781 3711
   08JUL94 3448 3045 3446 3620 3466 3533 3590 3070 3499 3457
   08JUL94 3411 3350 3417 3629 3400 3381 3309 3608 3438 3567
   11JUL94 3568 2968 3514 3465 3175 3358 3460 3851 3845 2983
   11JUL94 3410 3274 3590 3527 3509 3284 3457 3729 3916 3633
   12JUL94 3153 3408 3741 3203 3047 3580 3571 3579 3602 3335
   12JUL94 3494 3662 3586 3628 3881 3443 3456 3593 3827 3573
   13JUL94 3594 3711 3369 3341 3611 3496 3554 3400 3295 3002
   13JUL94 3495 3368 3726 3738 3250 3632 3415 3591 3787 3478
   14JUL94 3482 3546 3196 3379 3559 3235 3549 3445 3413 3859
   14JUL94 3330 3465 3994 3362 3309 3781 3211 3550 3637 3626
   15JUL94 3152 3269 3431 3438 3575 3476 3115 3146 3731 3171
   15JUL94 3206 3140 3562 3592 3722 3421 3471 3621 3361 3370
   18JUL94 3421 3381 4040 3467 3475 3285 3619 3325 3317 3472
   18JUL94 3296 3501 3366 3492 3367 3619 3550 3263 3355 3510
   ;
   run;
In the data set Turbine, each observation contains the date and the power output for a single heating. The first 20 observations contain the outputs for the first day, the second 20 observations contain the outputs for the second day, and so on. Because the variable Day classifies the observations into groups, it is referred to as the group variable. The variable KWatts contains the output measurements and is referred to as the analysis variable.
The following statements create a box plot showing the distribution of power output for each day:
   title 'Box Plot for Power Output';
   proc boxplot data=Turbine;
      plot KWatts*Day;
   run;
The input data set Turbine is specified with the DATA= option in the PROC BOXPLOT statement. The PLOT statement requests a box-and-whiskers plot for each group of data. After the keyword PLOT, you specify the analysis variable (in this case, KWatts), followed by an asterisk and the group variable (Day). The box plot is shown in Figure 24.1.
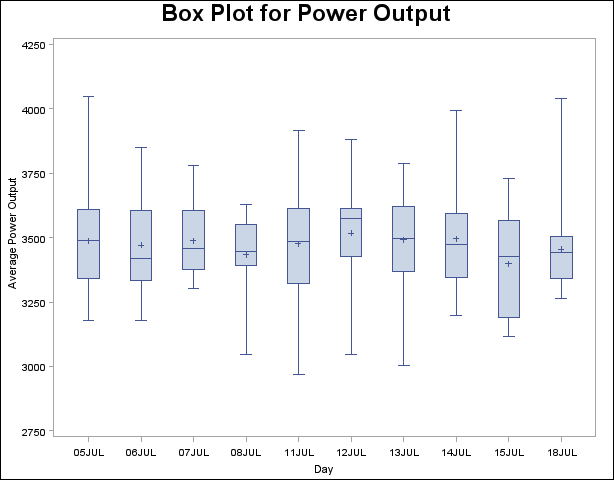
The box plot displayed in Figure 24.1 represents summary statistics for the analysis variable KWatts. Each of the 10 box-and-whiskers plots describes the variable KWatts for a particular day. The plot elements and the statistics they represent are as follows:
The length of the box represents the interquartile range (the distance between the
 th and
  th percentiles).
 The symbol in the box interior represents the group mean.
The horizontal line in the box interior represents the group median.
The vertical lines (called whiskers) issuing from the box extend to the group minimum and maximum values.
Copyright © 2009 by SAS Institute Inc., Cary, NC, USA. All rights reserved.