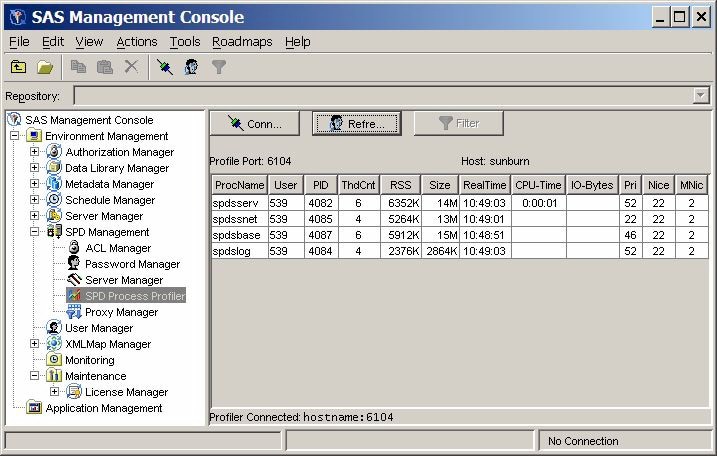
Overview of SPD Server Performance Server
SPD Server provides a performance monitoring server called spdsperf. SPD Server Performance
Server is an optional component and is not required for the normal operation of the
server.
Note: SPD Server Performance Server is
currently not available for the Windows or Linux X64 platforms.
The performance server
gathers server process performance information and posts it to the Server
Management section of the SAS Management Console application. The information consists of memory and resource allocations by users,
and server processes that were spawned by SPD Server. SPD Server owns a dynamic family
of subordinate server processes that users and
jobs create and terminate.
The information that is gathered by the performance server is stored in the SAS Management
Console. The SAS Management Console has a folder that is reserved for SPD Server management.
When you expand the SPD Management folder,
the next to last utility is SPD Process Profiler.
Highlight the SPD Process Profiler utility
to display the process information table, which contains performance
summary statistics. Each row in the table provides information about
a process that was spawned by the SPD Server.

The SPD Process Profiler displays information about memory and resource allocations.
For this reason, you can use the SAS Management Console to review which server processes
are occupying host computing resources; how the
resources are distributed across users and processes at a given point in time; and
whether the resource uses and distributions are appropriate for your computing environment.
You can do more than display performance summary statistics in the SAS Management
Console application. You can also configure the performance server when you launch
it to
create text log files that can be saved locally on the SPD Server host machine. SPD
Server is shipped with a PERL utility called process_perf_log that
can parse the log that the performance server created and a SAS program that can be
used to convert the log to an SPD Server table.
Copyright © SAS Institute Inc. All Rights Reserved.
Last updated: February 3, 2017