| Exploring Data in Two Dimensions |
Exploring Data in Two Dimensions
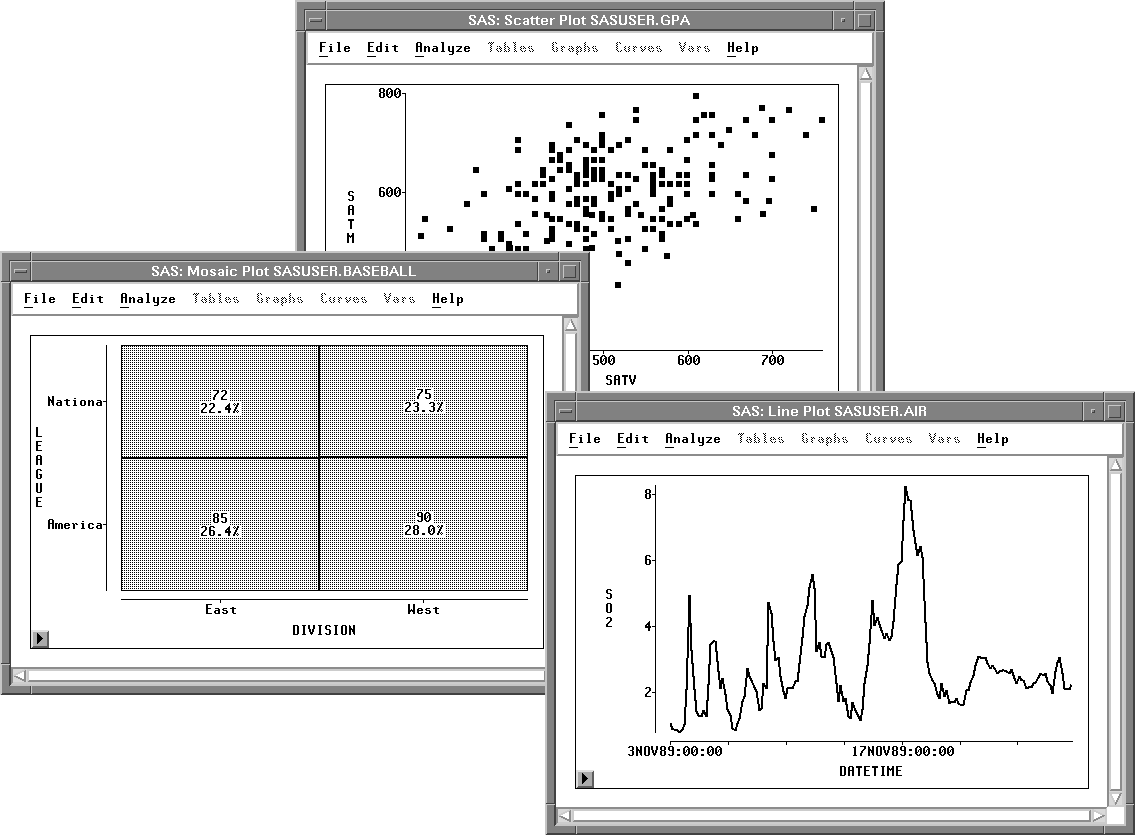
SAS/INSIGHT software provides mosaic plots, scatter plots, and line plots for exploring data in two dimensions. Mosaic plots are pictorial representations of frequency counts of nominal variables. Scatter plots are graphic representations of the relationship between two interval variables. Line plots show the relationships of multiple Y variables to a single X variable.

Figure 5.1: A Mosaic Plot, Scatter Plot, and Line Plot