MACHART Statement: MACONTROL Procedure

Example 9.7 Annotating Average Run Lengths on the Chart
See MACMA3 in the SAS/QC Sample LibraryYou can use Table 9.10 and Table 9.11 to find a moving average chart scheme with the desired average run length properties. Specifically, you can find a combination
of k and w that yields a desired ARL for an in-control process (![]() ) and for a specified shift of
) and for a specified shift of ![]() .
.
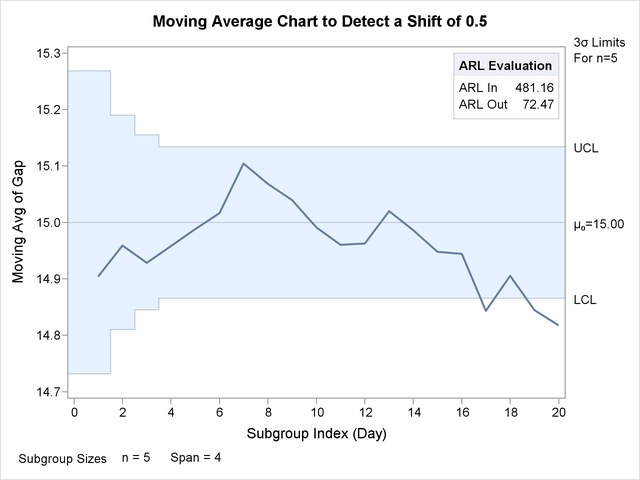
You can also use these tables to evaluate an existing moving average chart scheme. For example, the moving average chart shown
in Output 9.6.1 has a two-sided scheme with w = 4 and k = 3. Suppose you want to detect a shift of ![]() . From Table 9.11, the average run length with w = 4, k = 3, and
. From Table 9.11, the average run length with w = 4, k = 3, and ![]() is 72.47. The in-control average run length (
is 72.47. The in-control average run length (![]() ) for this scheme is 481.16.
) for this scheme is 481.16.
The following statements create an inset data set that can be read to display these ARL values on the moving average chart:
data ARLinset;
   length _label_ $ 8;
   _label_ = 'ARL In';
   _value_ = 481.16;
   output;
   _label_ = 'ARL Out';
   _value_ = 72.47;
   output;
run;
The following statements create the moving average chart shown in Output 9.7.1.
title 'Moving Average Chart to Detect a Shift of 0.5';
ods graphics on;
proc macontrol data=Clips1;
   machart Gap*Day / mu0      = 15
                     sigma0   = 0.2
                     span     = 4
                     xsymbol  = mu0
                     odstitle = title;
   inset data = ARLinset / header = 'ARL Evaluation'
                           pos    = ne;
run;
The average run lengths in this example (481.16 and 72.27) are simply copied from Table 9.11. You can generalize the preceding program so that it computes the average run lengths by incorporating the simulation program from the section Choosing the Span of the Moving Average.
Output 9.7.1: Displaying Average Run Lengths on Chart
For more information on annotating charts with insets, refer to INSET Statement: MACONTROL Procedure.