| The CUSUM Procedure |
Defining the Decision Interval for a One-Sided Cusum Scheme
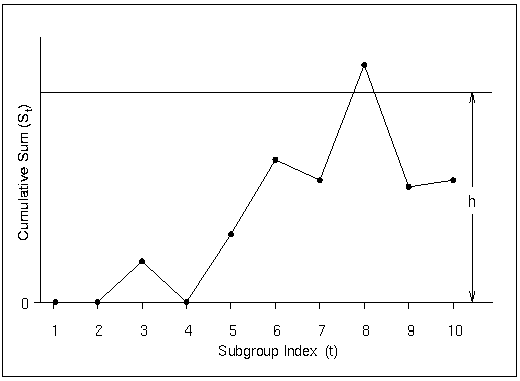
The height of the decision interval is  , expressed as a multiple of the standard error of the subgroup mean. You can specify with the H= option in the XCHART statement or with the variable _H_ in a LIMITS= data set. The decision interval is displayed as a horizontal line on the cusum chart, as illustrated in Figure 6.13.
Figure 6.13
Decision Interval
 if the cusum
  plotted at time
 Copyright © SAS Institute, Inc. All Rights Reserved.