The UNIVARIATE Procedure
- Overview
-
Getting Started

-
Syntax
-
DetailsMissing ValuesRoundingDescriptive StatisticsCalculating the ModeCalculating PercentilesTests for LocationConfidence Limits for Parameters of the Normal DistributionRobust EstimatorsCreating Line Printer PlotsCreating High-Resolution GraphicsUsing the CLASS Statement to Create Comparative PlotsPositioning InsetsFormulas for Fitted Continuous DistributionsGoodness-of-Fit TestsKernel Density EstimatesConstruction of Quantile-Quantile and Probability PlotsInterpretation of Quantile-Quantile and Probability PlotsDistributions for Probability and Q-Q PlotsEstimating Shape Parameters Using Q-Q PlotsEstimating Location and Scale Parameters Using Q-Q PlotsEstimating Percentiles Using Q-Q PlotsInput Data SetsOUT= Output Data Set in the OUTPUT StatementOUTHISTOGRAM= Output Data SetOUTKERNEL= Output Data SetOUTTABLE= Output Data SetTables for Summary StatisticsODS Table NamesODS Tables for Fitted DistributionsODS GraphicsComputational Resources
-
ExamplesComputing Descriptive Statistics for Multiple VariablesCalculating ModesIdentifying Extreme Observations and Extreme ValuesCreating a Frequency TableCreating Plots for Line Printer OutputAnalyzing a Data Set With a FREQ VariableSaving Summary Statistics in an OUT= Output Data SetSaving Percentiles in an Output Data SetComputing Confidence Limits for the Mean, Standard Deviation, and VarianceComputing Confidence Limits for Quantiles and PercentilesComputing Robust EstimatesTesting for LocationPerforming a Sign Test Using Paired DataCreating a HistogramCreating a One-Way Comparative HistogramCreating a Two-Way Comparative HistogramAdding Insets with Descriptive StatisticsBinning a HistogramAdding a Normal Curve to a HistogramAdding Fitted Normal Curves to a Comparative HistogramFitting a Beta CurveFitting Lognormal, Weibull, and Gamma CurvesComputing Kernel Density EstimatesFitting a Three-Parameter Lognormal CurveAnnotating a Folded Normal CurveCreating Lognormal Probability PlotsCreating a Histogram to Display Lognormal FitCreating a Normal Quantile PlotAdding a Distribution Reference LineInterpreting a Normal Quantile PlotEstimating Three Parameters from Lognormal Quantile PlotsEstimating Percentiles from Lognormal Quantile PlotsEstimating Parameters from Lognormal Quantile PlotsComparing Weibull Quantile PlotsCreating a Cumulative Distribution PlotCreating a P-P Plot
- References
This example, which is a continuation of Example 4.14, demonstrates various methods for binning a histogram. This example also illustrates how to save bin percentages in an OUTHISTOGRAM= data set.
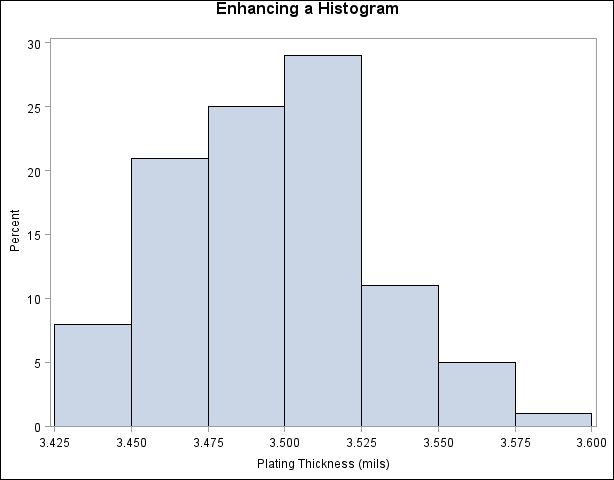
The manufacturer from Example 4.14 now wants to enhance the histogram by using the ENDPOINTS= option to change the endpoints of the bins. The following statements create a histogram with bins that have end points 3.425 and 3.6 and width 0.025:
title 'Enhancing a Histogram';
ods graphics off;
ods select HistogramBins MyHist;
proc univariate data=Trans;
   histogram Thick / midpercents name='MyHist'
                     endpoints = 3.425 to 3.6 by .025;
run;
The ODS SELECT statement restricts the output to the “HistogramBins” table and the “MyHist” histogram; see the section ODS Table Names. The ENDPOINTS= option specifies the endpoints for the histogram bins. By default, if the ENDPOINTS= option is not specified, the automatic binning algorithm computes values for the midpoints of the bins. The MIDPERCENTS option requests a table of the midpoints of each histogram bin and the percent of the observations that fall in each bin. This table is displayed in Output 4.18.1; the histogram is displayed in Output 4.18.2. The NAME= option specifies a name for the histogram that can be used in the ODS SELECT statement.
Output 4.18.1: Table of Bin Percentages Requested with MIDPERCENTS Option
| Enhancing a Histogram |
| Histogram Bins for Thick |
|
|---|---|
| Bin Minimum Point |
Observed Percent |
| 3.425 | 8.000 |
| 3.450 | 21.000 |
| 3.475 | 25.000 |
| 3.500 | 29.000 |
| 3.525 | 11.000 |
| 3.550 | 5.000 |
| 3.575 | 1.000 |
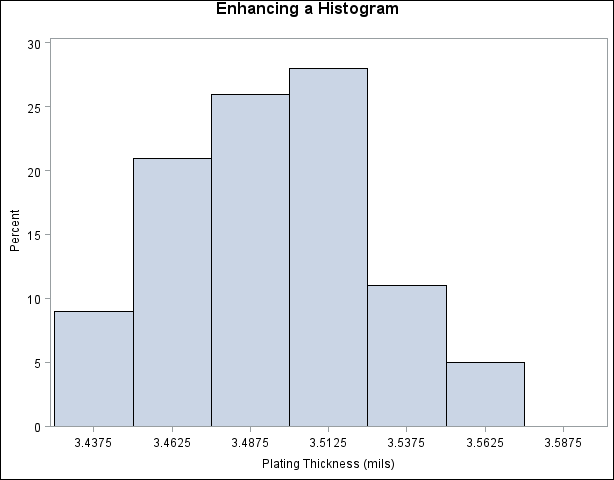
The MIDPOINTS= option is an alternative to the ENDPOINTS= option for specifying histogram bins. The following statements create a histogram, shown in Output 4.18.3, which is similar to the one in Output 4.18.2:
title 'Enhancing a Histogram';
ods graphics off;
proc univariate data=Trans noprint;
   histogram Thick / midpoints    = 3.4375 to 3.5875 by .025
                     rtinclude
                     outhistogram = OutMdpts;
run;
Output 4.18.3 differs from Output 4.18.2 in two ways:
-
The MIDPOINTS= option specifies the bins for the histogram by specifying the midpoints of the bins instead of specifying the endpoints. Note that the histogram displays midpoints instead of endpoints.
-
The RTINCLUDE option requests that the right endpoint of each bin be included in the histogram interval instead of the default, which is to include the left endpoint in the interval. This changes the histogram slightly from Output 4.18.2. Six observations have a thickness equal to an endpoint of an interval. For instance, there is one observation with a thickness of 3.45 mils. In Output 4.18.3, this observation is included in the bin from 3.425 to 3.45.
The OUTHISTOGRAM= option produces an output data set named OutMdpts, displayed in Output 4.18.4. This data set provides information about the bins of the histogram. For more information, see the section OUTHISTOGRAM= Output Data Set.
Output 4.18.4: The OUTHISTOGRAM= Data Set OutMdpts
| Enhancing a Histogram |
| Obs | _VAR_ | _MIDPT_ | _OBSPCT_ | _COUNT_ |
|---|---|---|---|---|
| 1 | Thick | 3.4375 | 9 | 9 |
| 2 | Thick | 3.4625 | 21 | 21 |
| 3 | Thick | 3.4875 | 26 | 26 |
| 4 | Thick | 3.5125 | 28 | 28 |
| 5 | Thick | 3.5375 | 11 | 11 |
| 6 | Thick | 3.5625 | 5 | 5 |
A sample program for this example, uniex08.sas, is available in the SAS Sample Library for Base SAS software.