The CORR Procedure
- Overview
- Getting Started
-
Syntax

-
Details
Pearson Product-Moment Correlation Spearman Rank-Order Correlation Kendall’s Tau-b Correlation Coefficient Hoeffding Dependence Coefficient Partial Correlation Fisher’s z Transformation Polyserial Correlation Cronbach’s Coefficient Alpha Confidence and Prediction Ellipses Missing Values In-Database Computation Output Tables Output Data Sets ODS Table Names ODS Graphics
-
Examples
Computing Four Measures of Association Computing Correlations between Two Sets of Variables Analysis Using Fisher’s z Transformation Applications of Fisher’s z Transformation Computing Polyserial Correlations Computing Cronbach’s Coefficient Alpha Saving Correlations in an Output Data Set Creating Scatter Plots Computing Partial Correlations
- References
| Confidence and Prediction Ellipses |
When the relationship between two variables is nonlinear or when outliers are present, the correlation coefficient might incorrectly estimate the strength of the relationship. Plotting the data enables you to verify the linear relationship and to identify the potential outliers.
The partial correlation between two variables, after controlling for variables in the PARTIAL statement, is the correlation between the residuals of the linear regression of the two variables on the partialled variables. Thus, if a PARTIAL statement is also specified, the residuals of the analysis variables are displayed in the scatter plot matrix and scatter plots.
The CORR procedure optionally provides two types of ellipses for each pair of variables in a scatter plot. One is a confidence ellipse for the population mean, and the other is a prediction ellipse for a new observation. Both assume a bivariate normal distribution.
Let  and
and  be the sample mean and sample covariance matrix of a random sample of size
  from a bivariate normal distribution with mean
  and covariance matrix
  . The variable
  is distributed as a bivariate normal variate with mean zero and covariance
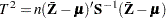
  , and it is independent of . Using Hotelling’s
  statistic, which is defined as
 |
a  confidence ellipse for is computed from the equation
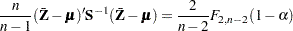 |
where  is the
  critical value of an
  distribution with degrees of freedom
  and
and  .
.
A prediction ellipse is a region for predicting a new observation in the population. It also approximates a region that contains a specified percentage of the population.
Denote a new observation as the bivariate random variable  . The variable
 |
is distributed as a bivariate normal variate with mean zero (the zero vector) and covariance  , and it is independent of . A prediction ellipse is then given by the equation
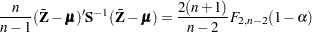 |
The family of ellipses generated by different critical values of the distribution has a common center (the sample mean) and common major and minor axis directions.
The shape of an ellipse depends on the aspect ratio of the plot. The ellipse indicates the correlation between the two variables if the variables are standardized (by dividing the variables by their respective standard deviations). In this situation, the ratio between the major and minor axis lengths is
 |
In particular, if  , the ratio is 1, which corresponds to a circular confidence contour and indicates that the variables are uncorrelated. A larger value of the ratio indicates a larger positive or negative correlation between the variables.