| The CORR Procedure |
Example 2.7 Creating Scatter Plots
The following statements request a correlation analysis and a scatter plot matrix for the variables in the data set Fish1, which was created in Example 2.5. This data set contains 35 observations, one of which contains a missing value for the variable Weight3.
ods graphics on;
title 'Fish Measurement Data';
proc corr data=fish1 nomiss plots=matrix(histogram);
   var Height Width Length3 Weight3;
 run;
ods graphics off;
The "Simple Statistics" table in Output 2.7.1 displays univariate descriptive statistics for analysis variables.
| 4 Variables: | Height Width Length3 Weight3 |
|---|
When you specify the NOMISS option, the same set of 34 observations is used to compute the correlation for each pair of variables. The "Pearson Correlation Coefficients" table in Output 2.7.2 displays Pearson correlation statistics for pairs of analysis variables.
| Pearson Correlation Coefficients, N = 34 Prob > |r| under H0: Rho=0 |
||||||||||||
|---|---|---|---|---|---|---|---|---|---|---|---|---|
| Height | Width | Length3 | Weight3 | |||||||||
| Height |
|
|
|
|
||||||||
| Width |
|
|
|
|
||||||||
| Length3 |
|
|
|
|
||||||||
| Weight3 |
|
|
|
|
||||||||
The variables are highly correlated. For example, the correlation between Height and Width is 0.92632.
The PLOTS=MATRIX(HISTOGRAM) option requests a scatter plot matrix for the VAR statement variables in Output 2.7.3.
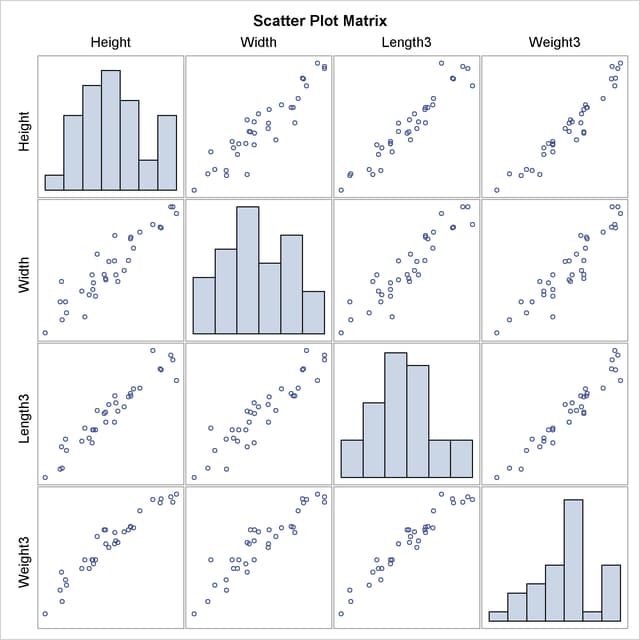
In order to create this display, you must specify the ODS GRAPHICS ON statement in addition to the PLOTS= option. For more information about the ODS GRAPHICS statement, see Chapter 21, Statistical Graphics Using ODS (SAS/STAT 9.22 User's Guide).
To explore the correlation between Height and Width, the following statements display (in Output 2.7.4) a scatter plot with prediction ellipses for the two variables:
ods graphics on;
proc corr data=fish1 nomiss
          plots=scatter(nvar=2 alpha=.20 .30);
   var Height Width Length3 Weight3;
 run;
ods graphics off;
The NOMISS option is specified with the original VAR statement to ensure that the same set of 34 observations is used for this analysis. The PLOTS=SCATTER(NVAR=2) option requests a scatter plot for the first two variables in the VAR list. The ALPHA=.20 .30 suboption requests  and
and  prediction ellipses, respectively.
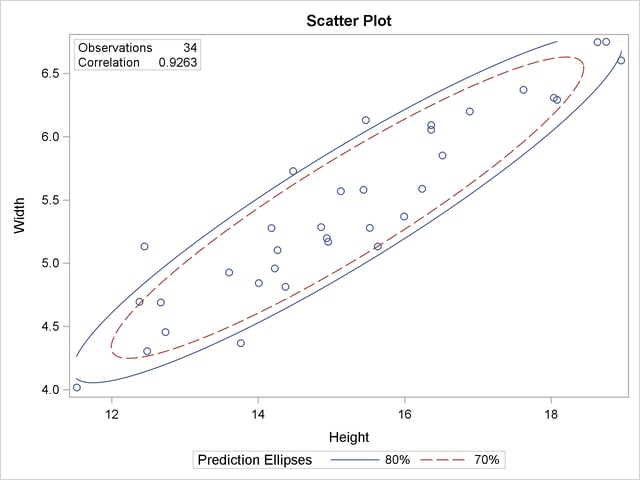
A prediction ellipse is a region for predicting a new observation from the population, assuming bivariate normality. It also approximates a region containing a specified percentage of the population. The displayed prediction ellipse is centered at the means  . For further details, see the section Confidence and Prediction Ellipses.
Note that the following statements also display (in Output 2.7.5) a scatter plot for Height and Width:
ods graphics on;
proc corr data=fish1
          plots=scatter(alpha=.20 .30);
   var Height Width;
 run;
ods graphics off;
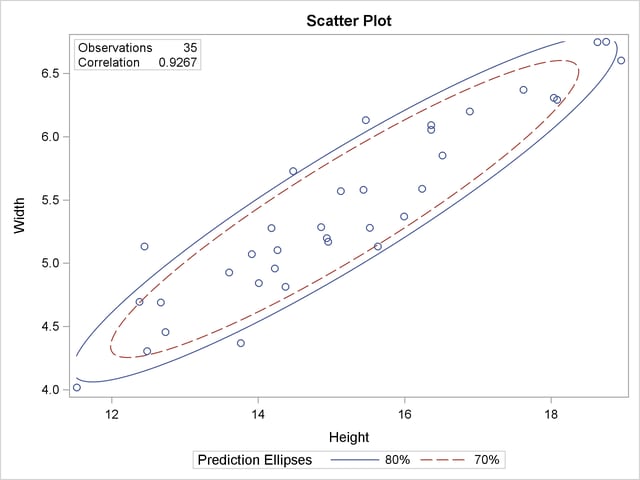
Output 2.7.5 includes the point  , which was excluded from Output 2.7.4 because the observation had a missing value for Weight3. The prediction ellipses in Output 2.7.5 also reflect the inclusion of this observation.
The following statements display (in Output 2.7.6) a scatter plot with confidence ellipses for the mean:
ods graphics on;
title 'Fish Measurement Data';
proc corr data=fish1 nomiss
          plots=scatter(ellipse=confidence nvar=2 alpha=.05 .01);
   var Height Width Length3 Weight3;
 run;
ods graphics off;
The NVAR=2 suboption within the PLOTS= option restricts the number of plots created to the first two variables in the VAR statement, and the ELLIPSE=CONFIDENCE suboption requests confidence ellipses for the mean. The ALPHA=.05 .01 suboption requests  and
and  confidence ellipses, respectively.
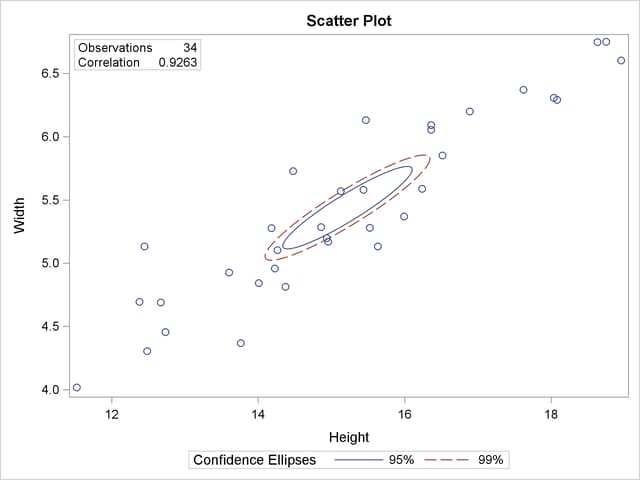
The confidence ellipse for the mean is centered at the means . For further details, see the section Confidence and Prediction Ellipses.
Copyright © SAS Institute, Inc. All Rights Reserved.