TIMEPLOT Procedure

Example 2: Customizing an Axis and a Plotting Symbol
| Features: |
ID statement
|
| Other features: |
LABEL statement PROC FORMAT SAS system options: : FMTSEARCH= |
| Data set: | SALES |
Program
libname proclib
'SAS-library';
options formchar="|----|+|---+=|-/\<>*" fmtsearch=(proclib);
proc format library=proclib;
   value monthfmt 1='January'
                 2='February';
run;
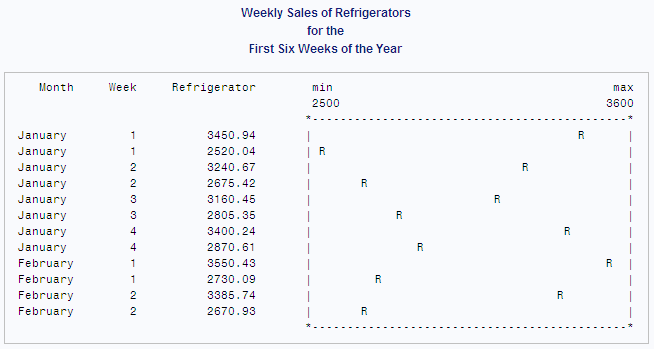
proc timeplot data=sales;
   plot icebox='R' / axis=2500 to 3600 by 25;
id month week;
label icebox='Refrigerator';
format month monthfmt.;
   title 'Weekly Sales of Refrigerators';
   title2 'for the';
   title3 'First Six Weeks of the Year';
run;
Program Description
Set the SAS system options.Setting FORMCHAR to this exact string renders better HTML output
when it is viewed outside of the SAS environment where SAS Monospace
fonts are not available. FMTSEARCH= adds the SAS library PROCLIB
to the search path that is used to locate formats.
Create a format for the Month variable. PROC FORMAT creates a permanent format for Month.
The LIBRARY= option specifies a permanent storage location so that
the formats are available in subsequent SAS sessions. This format
is used for examples throughout this chapter.
Plot sales of refrigerators. The plot variable, Icebox, appears in both the listing and the output.
The plotting symbol is 'R'. AXIS= sets the minimum value of the axis
to 2500 and the maximum value to 3600. BY 25 specifies that each print
position on the axis represents 25 units (in this case, dollars).
Label the rows in the listing. The values of the ID variables, Month and Week, are used to uniquely
identify each row of the listing.
Apply a label to the sales column in the listing. The LABEL statement associates a label with the
variable Icebox for the duration of the PROC TIMEPLOT step. PROC TIMEPLOT
uses the label as the column heading in the listing.