The GANTT Procedure
- Overview
- Getting Started
-
Syntax

-
Details
Schedule Data Set Missing Values in Input Data Sets Specifying the PADDING= Option Page Format Multiple Calendars and Holidays Full-Screen Version Graphics Version Specifying the Logic Options Automatic Text Annotation Web-Enabled Gantt Charts Mode-Specific Differences Displayed Output Macro Variable ORGANTT Computer Resource Requirements ODS Style Definitions
-
Examples
Line-Printer Examples Printing a Gantt Chart Customizing the Gantt Chart Graphics Examples Marking Holidays Marking Milestones and Special Dates Using the COMPRESS Option Using the MININTERVAL= and SCALE= Options Using the MINDATE= and MAXDATE= Options Variable Length Holidays Multiple Calendars Plotting the Actual Schedule Comparing Progress Against a Baseline Schedule Using the COMBINE Option Plotting the Resource-Constrained Schedule Specifying the Schedule Data Directly BY Processing Gantt Charts by Persons Using the HEIGHT= and HTOFF= Options Drawing a Logic Gantt Chart Using AON Representation Specifying the Logic Control Options Nonstandard Precedence Relationships Using the SAS/GRAPH ANNOTATE= Option Using the Automatic Text Annotation Feature Multiproject Gantt Charts Multisegment Gantt Charts Zoned Gantt Charts Web-Enabled Gantt Charts Using the CHARTWIDTH= Option Using the TIMEAXISFORMAT= Option Statement and Option Cross-Reference Tables
- References
Example 8.21 Using the SAS/GRAPH ANNOTATE= Option
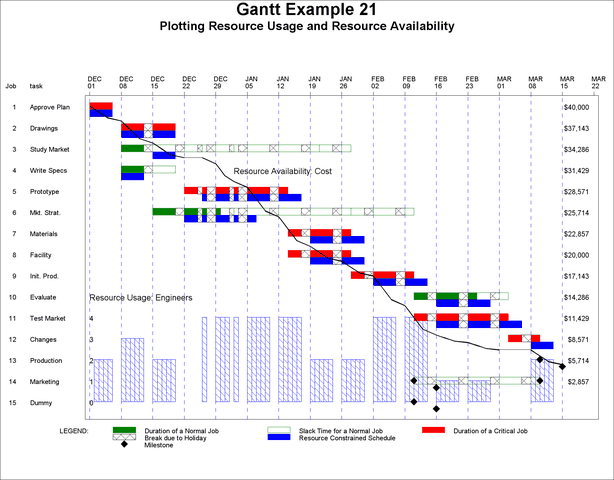
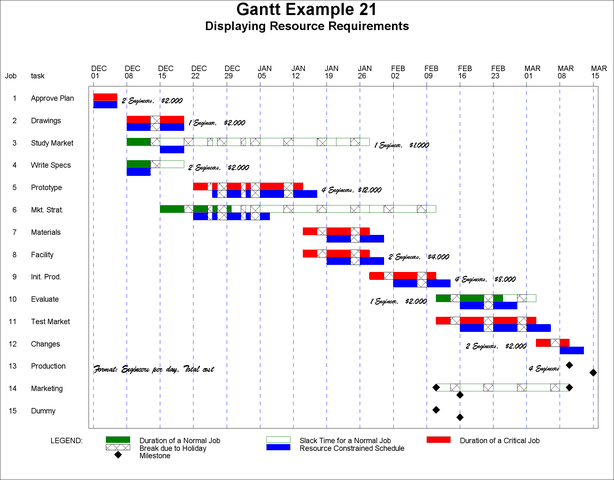
This example illustrates the use of the ANNOTATE= option to add graphics and text to the body of the Gantt chart. The intent of the first invocation of PROC GANTT is to display the resource requirements of each activity on the Gantt chart, while that of the second invocation is to plot the resource usage bar chart for the replenishable resource engineers and the resource availability curve for the consumable resource cost.
The data for this example come from Example 4.15, in which the widget manufacturing project is scheduled using PROC CPM subject to resource constraints. The project network is defined in the WIDGRES data set using AOA format. The number of engineers needed per day per activity is a replenishable resource and is identified by the ENGINEER variable in the WIDGRES data set. The cost incurred per day per activity is a consumable resource and is identified by the ENGCOST variable in the WIDGRES data set. The WIDGRIN data set specifies the resource availabilities for the project. The schedule produced by PROC CPM using the default choice of LST as a heuristic is shown in Output 8.21.1. The following programs assume that the schedule is stored in the WIDGSCH2 data set and that the resource usage is stored in the WIDGROU2 data set.
The Annotate macros are used in this example to simplify the process of creating Annotate observations. The ANNOMAC macro is first used to compile the Annotate macros and make them available for use. The Annotate data set ANNO1 is then created using the Annotate macros. The DCLANNO macro declares all Annotate variables except the TEXT variable, and the SYSTEM macro defines the Annotate reference system. The coordinate system defined here uses date for the horizontal scale and job number for the vertical scale. The text to be displayed contains the number of engineers required per day and the total cost over the duration of the activity. The LABEL macro is used to annotate the necessary text on the Gantt chart using the BRUSH font.
The GANTT procedure is invoked with the ANNOTATE=ANNO1 specification in the PROC GANTT statement. The resulting Gantt chart is shown in Output 8.21.2. It is important to note that the job number will be used for the vertical scale even if NOJOBNUM is specified in the CHART statement.
| Resource Constrained Schedule: Rule = LST |
| Obs | tail | head | days | task | engineer | engcost | S_START | S_FINISH | E_START | E_FINISH | L_START | L_FINISH | R_DELAY | DELAY_R | SUPPL_R |
|---|---|---|---|---|---|---|---|---|---|---|---|---|---|---|---|
| 1 | 1 | 2 | 5 | Approve Plan | 2 | 400 | 01DEC03 | 05DEC03 | 01DEC03 | 05DEC03 | 01DEC03 | 05DEC03 | 0 | ||
| 2 | 2 | 3 | 10 | Drawings | 1 | 200 | 08DEC03 | 19DEC03 | 08DEC03 | 19DEC03 | 08DEC03 | 19DEC03 | 0 | ||
| 3 | 2 | 4 | 5 | Study Market | 1 | 200 | 15DEC03 | 19DEC03 | 08DEC03 | 12DEC03 | 21JAN04 | 27JAN04 | 5 | engineer | |
| 4 | 2 | 3 | 5 | Write Specs | 2 | 400 | 08DEC03 | 12DEC03 | 08DEC03 | 12DEC03 | 15DEC03 | 19DEC03 | 0 | ||
| 5 | 3 | 5 | 15 | Prototype | 4 | 800 | 26DEC03 | 16JAN04 | 22DEC03 | 13JAN04 | 22DEC03 | 13JAN04 | 3 | engineer | |
| 6 | 4 | 6 | 10 | Mkt. Strat. | . | . | 22DEC03 | 06JAN04 | 15DEC03 | 29DEC03 | 28JAN04 | 10FEB04 | 0 | ||
| 7 | 5 | 7 | 10 | Materials | . | . | 19JAN04 | 30JAN04 | 14JAN04 | 27JAN04 | 14JAN04 | 27JAN04 | 0 | ||
| 8 | 5 | 7 | 10 | Facility | 2 | 400 | 19JAN04 | 30JAN04 | 14JAN04 | 27JAN04 | 14JAN04 | 27JAN04 | 0 | ||
| 9 | 7 | 8 | 10 | Init. Prod. | 4 | 800 | 02FEB04 | 13FEB04 | 28JAN04 | 10FEB04 | 28JAN04 | 10FEB04 | 0 | ||
| 10 | 8 | 9 | 10 | Evaluate | 1 | 200 | 16FEB04 | 27FEB04 | 11FEB04 | 24FEB04 | 18FEB04 | 02MAR04 | 0 | ||
| 11 | 6 | 9 | 15 | Test Market | . | . | 16FEB04 | 05MAR04 | 11FEB04 | 02MAR04 | 11FEB04 | 02MAR04 | 0 | ||
| 12 | 9 | 10 | 5 | Changes | 2 | 400 | 08MAR04 | 12MAR04 | 03MAR04 | 09MAR04 | 03MAR04 | 09MAR04 | 0 | ||
| 13 | 10 | 11 | 0 | Production | 4 | 800 | 15MAR04 | 15MAR04 | 10MAR04 | 10MAR04 | 10MAR04 | 10MAR04 | 0 | ||
| 14 | 6 | 12 | 0 | Marketing | . | . | 16FEB04 | 16FEB04 | 11FEB04 | 11FEB04 | 10MAR04 | 10MAR04 | 0 | ||
| 15 | 8 | 6 | 0 | Dummy | . | . | 16FEB04 | 16FEB04 | 11FEB04 | 11FEB04 | 11FEB04 | 11FEB04 | 0 |
title c=black h=1.75 'Gantt Example 21';
title2 c=black h=1.25 'Displaying Resource Requirements';

* set background to white and text to black;
goptions ctext=black cback=white;

* set graphics options;
goptions vpos=50 hpos=100 htext=1.01;

* begin annotate process;

* compile annotate macros;
%annomac;
* create annotate data set for first chart;
data anno1;
   %dclanno;       /* set length and type for annotate variables */
   %system(2,2,4); /* define annotate reference system           */
   set widgsch2;
   length lab $20;
   length TEXT $ 37;
   Y1 = _n_;
   lab='    ';

   if _n_=1 then do;
      %label('01dec03'd,13,
             'Format: Engineers per day, Total cost',*,0,0,1.2,brush,6);
      end;

   if engineer ^= . then do;
      /* create a text label */
      lab = put(engineer, 1.) || " Engineer";
      if engineer > 1 then lab = trim(lab) || "s";
      if days > 0 then lab = trim(lab) || ", " ||
                                            put(engcost*days, dollar7.);

      /* position the text label */
      if y1 < 10 then do;
         x1 = max(l_finish, s_finish) + 2;
         %label(x1,y1,lab,black,0,0,1.0,brush, 6);
         end;
      else do;
         x1 = e_start - 2;
         %label(x1,y1,lab,black,0,0,1.0,brush, 4);
         end;
      end;
run;
* annotate the Gantt chart;
proc gantt graphics data=widgsch2 holidata=holdata annotate=anno1;
chart / pcompress holiday=(hol) interval=weekday increment=7
        ref='1dec03'd to '21mar04'd by week
        cref=blue lref=2
        dur=days cmile=black caxis=black;
id task;
run;
The next illustration of the ANNOTATE= option is to plot the resource usage bar chart for the replenishable resource engineers and the resource availability curve for the consumable resource cost. A DATA step determines the largest value of the cost availability throughout the life of the project in order to scale the costs accordingly. The CSCALE macro variable is required to represent cost availabilities on the Gantt chart. Since there are no further cash inflows after December 1, 2003, and there are 15 jobs represented on the chart, the value of the macro variable CSCALE is  .
.
An Annotate data set, ANNO2, is created in much the same fashion as ANNO1, but it employs some additional macros. The BAR macro is used to draw the resource usage bar chart, and the DRAW and MOVE macros are used to draw the resource availability curve. The PUSH and POP macros are used as necessary to store and retrieve the last used coordinates from the stack, respectively. The resulting Gantt chart is displayed in Output 8.21.3.
* calculate scaling factor for cost curve;
data _null_;
   set widgrou2 end=final;
   retain maxcost;
   if aengcost > maxcost then maxcost=aengcost;
   if final then call symput('cscale',14/maxcost);
   run;

* create annotate data set for second chart;
data anno2;
   %dclanno;       /* set length and type for annotate variables */
   %system(2,2,4); /* define annotate reference system           */
   set widgrou2;
   length lab $16;
   length TEXT $27;
   x1=_time_;
   y1=15-aengcost*symget('cscale');
   y2=15-rengineer;
   lab='    ';

   if _n_=1 then do;
      /* print labels */
      do i = 1 to 14 by 1;
         lab=put( (15-i) / symget('cscale'), dollar7.);
         %label('21mar04'd,i,lab,black,0,0,1.0,,4);
         end;
      do i = 0 to 4 by 1;
         lab=put(i,1. );
         %label('01dec03'd,15-i,lab,black,0,0,1.0,,6);
         end;
      %label('01dec03'd,10,
             'Resource Usage: Engineers',*,0,0,1.2,,6);
      %label('02jan04'd,4,
             'Resource Availability: Cost',*,0,0,1.2,,6);
      %move(x1,y1);
      %push;
      end;
   else do;
      /* draw cost availability curve */
      %pop;
      when='a';
      %draw(x1,y1,black,1,2);
      %push;
      /* draw engineer usage barchart */
      when='b';
      if y2 <= 14 then do;
         %bar(x1,15,x1+1,y2,blue,0,l1);
         end;
      end;
   run;
title c=black h=1.75 'Gantt Example 21';
title2 c=black h=1.25
       'Plotting Resource Usage and Resource Availability';

* annotate the Gantt chart;
proc gantt graphics data=widgsch2 holidata=holdata annotate=anno2;
chart / pcompress holiday=(hol) interval=weekday increment=7
        mindate='1dec03'd maxdate='21mar04'd
        ref='1dec03'd to '21mar04'd by week
        cref=blue lref=2
        dur=days cmile=black caxis=black;
id task;
run;