| The NETDRAW Procedure |
Example 7.12: Schematic Diagrams
You can use PROC NETDRAW to determine node placement and arc routing for any network depicting a set of nodes connected by arcs. If you want the procedure to determine the node placement, the network must be acyclic. This example illustrates the use of PROC NETDRAW to draw two networks that represent different schematic flows. The first network does not contain any cycles, while the second one has one cycle; to draw the second network, you need to use the BREAKCYCLE option.
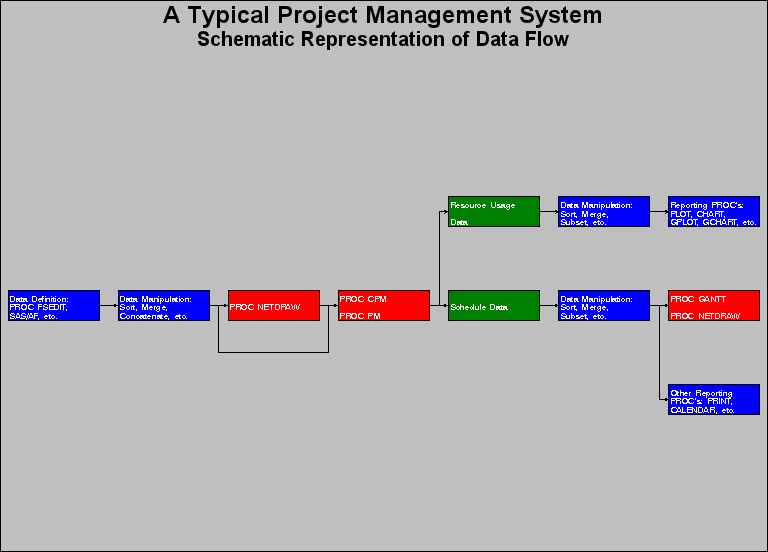
First, a schematic representation of the data flow going in and out of the three procedures (CPM, GANTT, and NETDRAW) is drawn using PROC NETDRAW. (See Chapter 1, "Introduction to Project Management," for a detailed discussion of such a data flow.) The PATTERN= option is used to specify the variable in the data set that identifies the color that is to be used for each node. Nodes representing SAS/OR procedures are colored red, the ones representing output data sets are colored green, and all other nodes (representing the use of other parts of the SAS System) are colored blue. Three ID variables are used to specify the text that is to be placed within each node. The flow diagram is shown in Output 7.12.1.
    data dataflow;
       format id1 $18. id2 $14. id3 $19. ;
       input a $ b $ id1 & id2 & id3 & style;
       datalines;
    A B Data Definition:    PROC FSEDIT,    SAS/AF, etc.         2
    B C Data Manipulation:  Sort, Merge,    Concatenate, etc.    2
    B D Data Manipulation:  Sort, Merge,    Concatenate, etc.    2
    D C .                   PROC NETDRAW    .                    1
    C E PROC CPM            .               PROC PM              1
    C F PROC CPM            .               PROC PM              1
    E H Resource Usage      .               Data                 3
    F G .                   Schedule Data   .                    3
    G I Data Manipulation:  Sort, Merge,    Subset, etc.         2
    G J Data Manipulation:  Sort, Merge,    Subset, etc.         2
    H K Data Manipulation:  Sort, Merge,    Subset, etc.         2
    I . Other Reporting     PROC's: PRINT,  CALENDAR, etc.       2
    J . PROC GANTT          .               PROC NETDRAW         1
    K . Reporting PROC's:   PLOT, CHART,    GPLOT, GCHART, etc.  2
    ;
    goptions hpos=110 vpos=70;
    pattern1 v=s c=red;
    pattern2 v=s c=blue;
    pattern3 v=s c=green;

    title  h=3   'A Typical Project Management System';
    title2 h=2.5 'Schematic Representation of Data Flow';
    proc netdraw data=dataflow graphics;
       actnet / act=a succ=b id = (id1-id3)
                nodefaultid font=swiss
                nolabel
                pattern=style
                carcs=black
                coutline=black
                ctext=white
                hmargin = 2
                ybetween = 15
                rectilinear
                noarrowfill
                pcompress
                htext=2;
       run;
Output 7.12.1: Schematic Representation of Data Flow
|
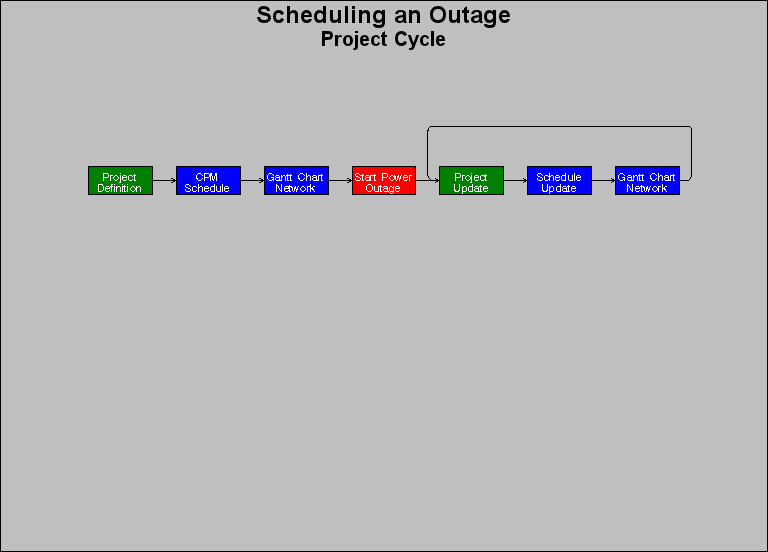
Next, a typical sequence of procedures followed at the scheduling
of a nuclear power plant outage is shown using the NETDRAW procedure.
Such a schematic diagram is illustrated in Chapter 1, "Introduction to Project Management." In
Figure 1.6, there is a cycle that
is not normally allowed in a Network data set that is input to
PROC NETDRAW.
However, you can draw such networks by specifying the BREAKCYCLE option.
(Note that you can also draw cyclic networks by specifying explicitly
the node coordinates or an ALIGN= variable that fixes the ![]() coordinates
for each node.)
coordinates
for each node.)
In this example, the data set OUTAGE contains the network representation. The variable style is used to color nodes appropriately. The resulting diagram is shown in Output 7.12.2.
    data outage;
       format id1 $12. id2 $12. ;
       input a $ b $ id1 & id2 & style;
       datalines;
    A   B   Project       Definition       1
    B   C   CPM           Schedule         2
    C   D   Gantt Chart   Network          3
    D   E   Start Power   Outage           4
    E   F   Project       Update           1
    F   G   Schedule      Update           2
    G   E   Gantt Chart   Network          3
    ;

    goptions hpos=110 vpos=70;
    pattern1 v=s c=green;
    pattern2 v=s c=blue;
    pattern3 v=s c=blue;
    pattern4 v=s c=red;

    title  h=3    'Scheduling an Outage';
    title2 h=2.5  'Project Cycle';
    proc netdraw data=outage graphics;
       actnet / act=a succ=b id = (id1 id2)
                breakcycle
                nodefaultid
                font=swiss
                centerid
                vmargin = 5 hmargin = 0
                nolabel
                novcenter
                pattern=style
                carcs=black coutline=black ctext=white
                ybetween = 15 xbetween=3
                noarrowfill
                pcompress
                htext=2;
       run;
Output 7.12.2: Scheduling a Power Outage
|
Copyright © 2008 by SAS Institute Inc., Cary, NC, USA. All rights reserved.