| The GANTT Procedure |
Example 6.18: Drawing a Logic Gantt Chart Using AON Representation
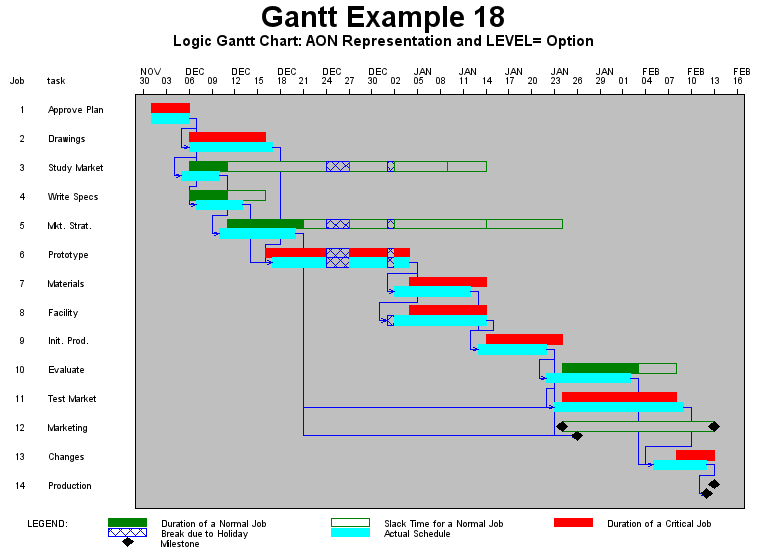
This example uses the data of Example 6.10, which illustrates the drawing of the actual schedule. The ACTIVITY= and SUCCESSOR= options are specified in the CHART statement to define the precedence relationships using the AON format to PROC GANTT. Since no LAG= option is specified, the lag type of each connection is assumed to be Finish-to-Start (FS). In this case, the precedence defining variables exist in the WIDGELA data set; however, this is not a requirement. The precedence defining variables can belong to a different data set as long as the ACTIVITY variable is common to both data sets and the PRECDATA= option, identifying the Precedence data set, is specified in the PROC GANTT statement. Setting the LEVEL= option to 2 causes the actual schedule bar to be used as the logic bar; that is, PROC GANTT draws the precedence connections with respect to the actual schedule. By default, the precedence connections are drawn with respect to the first bar. The color of the precedence connections is specified with the CPREC= option in the CHART statement. You can change the line style and line width of the precedence connections by specifying the LPREC= and WPREC= options in the CHART statement. The resulting Gantt chart is shown in Output 6.18.1.
    title 'Gantt Example 18';
    title2
       'Logic Gantt Chart: AON Representation and LEVEL= Option';

    * sort the data;
    proc sort;
       by e_start;
       run;

    * set vpos to 50 and hpos to 100;
    goptions vpos=50 hpos=100;


    * set background to ltgray;
    goptions cback=ltgray;
    * set up required pattern statements;
    pattern1 c=green v=s;  /* duration of a noncrit. activity  */
    pattern2 c=green v=e;  /* slack time for a noncrit. act.   */
    pattern3 c=red   v=s;  /* duration of a critical activity  */
    pattern4 c=green v=s;  /* slack time for a supercrit. act. */
    pattern5 c=green v=e;  /* duration of a supercrit. act.    */
    pattern6 c=cyan  v=s;  /* actual duration of an activity   */
    pattern7 c=blue  v=x1; /* break due to a holiday           */
    * draw the Logic Gantt chart;
    proc gantt data=widgela holidata=holidays;
       chart / holiday=(holiday) holifin=(holifin)
               a_start=sdate a_finish=fdate
               cmile=black dur=days
               activity=task successor=(succ1-succ3)
               level=2
               cprec=blue
               compress;
       id task;
       run;
Output 6.18.1: Drawing a Logic Gantt Chart Using AON Representation

|
Copyright © 2008 by SAS Institute Inc., Cary, NC, USA. All rights reserved.