| Introduction to Optimization |
Other Reporting Procedures
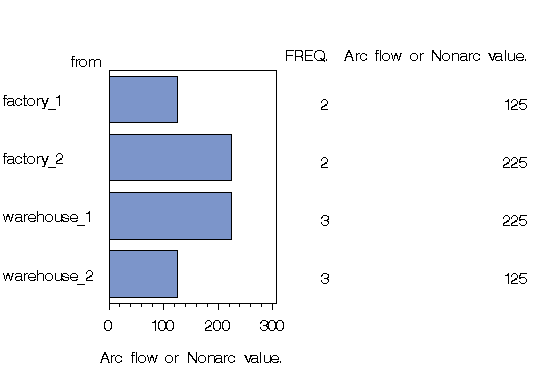
The GCHART procedure can be a useful tool for displaying the solution to mathematical programming models. The con_solv data set that contains the solution to the balanced transshipment problem can be effectively displayed using PROC GCHART. In Figure 1.9, the amount that is shipped from each factory and warehouse can be seen by submitting the following SAS code:
    title;
    proc gchart data=con_sav;
       hbar from / sumvar=_flow_;
    run;
|
Figure 1.9: Tie Problem: Throughputs
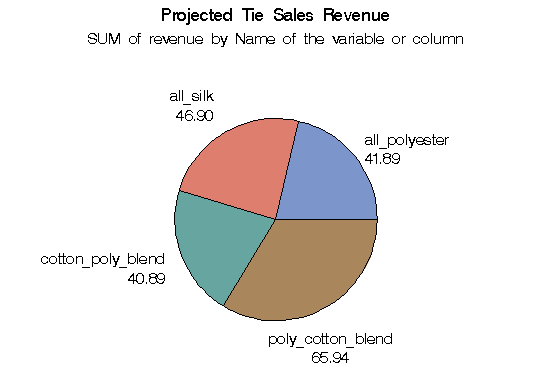
The horizontal bar chart is just one way of displaying the solution to a mathematical program. The solution to the Tie Product Mix problem that was solved using PROC LP can also be illustrated using PROC GCHART. Here, a pie chart shows the relative contribution of each product to total revenues.
    proc gchart data=product;
       pie _var_ / sumvar=revenue;
    title 'Projected Tie Sales Revenue';
    run;
|
Figure 1.10: Tie Problem: Projected Tie Sales Revenue
The TABULATE procedure is another procedure that can help automate solution reporting. Several examples in Chapter 3, "The LP Procedure," illustrate its use.
Copyright © 2008 by SAS Institute Inc., Cary, NC, USA. All rights reserved.