Format a Champion and Challenger Performance Report
About the Champion and Challenger Performance Report
After you execute a
performance task for the champion model, you can execute a performance
task for the challenger model using the same performance data sets.
SAS Model Manager updates the output data sets in the Resources folder
with the performance data for the challenger model. You can create
a Champion and Challenger Performance report that compares the performance
of the two models.
Number of Predictors Exceeding Deviation Threshold
This characteristic
report creates a chart for each index exceeding a deviation threshold
(either 0.1 or 0.25) as indicated in the define performance task.
The characteristic report detects shifts in the distribution of input
variables over time.
Gini - Trend
When the Gini - ROC
Chart is created, the Gini index for each ROC curve is also created.
The Gini coefficient represents the area under the ROC curve and is
a benchmark statistic that can be used to summarize the predictive
accuracy of a model. The Gini - Trend Chart plots a model's Gini
index scores over time, and these are used to monitor model degradation
over time.
Gini - ROC Chart
Sensitivity is the
proportion of true positive events and specificity is the proportion
of true negative events. The Gini - ROC Chart plots Sensitivity on
the Y axis and 1 - Specificity on the X axis.
KS Trend Chart
When you create a Kolmogorov-Smirnov
report, the KS statistic and the corresponding probability cutoff
are computed for each Kolmogorov-Smirnov table. The KS Trend Chart
uses a summary data set that plots the KS Statistic and the probability
cutoff values over time. The KS Trend Chart is used to monitor model
degradation over time.
KS Chart
The KS Chart uses the
Kolmogorov-Smirnov statistic to measure the maximum vertical separation,
or deviation between the cumulative distributions of events and non-events.
Verify Performance Data and Model Status
-
Verify that performance monitoring data is available for the champion model and the challenger model. Performance monitoring results must exist for the same performance data using the same time periods and data labels. Click the Resources node and select the file jobstatus.sas7bdat. The Content tab displays performance monitoring status data.


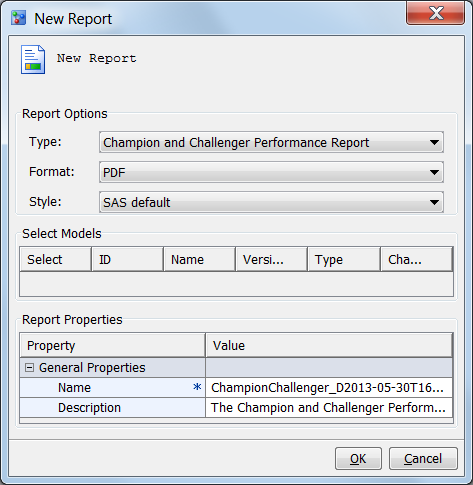
Create a Champion and Challenger Performance Report
-
In the Report Properties table, complete the Name and Description properties if you do not want to use the default values. The default value for the Name property uses the form ChampionChallenger_DdateTtime. The name can contain letters, spaces, the underscore ( _ ), the hyphen ( - ), and the period ( . ).
Copyright © SAS Institute Inc. All rights reserved.