Why SAS Enterprise Guide Reports Do Not Display Correctly

Determining Why the Report’s Style Sheet, Banner, or Template Are Incorrect

If your reports do not use the correct style or colors, you might not have the correct SAS Enterprise Guide ITRM files installed, or they might not be installed correctly. To determine whether this is the problem, perform the following steps:
Verify that you are using the correct version of the SAS Enterprise Guide options file.
  1. From the menu bar of SAS Enterprise Guide, select Toolsthen selectOptions.
  2. Select Tasksthen selectCustom Code.
  3. Verify that the Insert custom SAS code box before task and query code is checked.
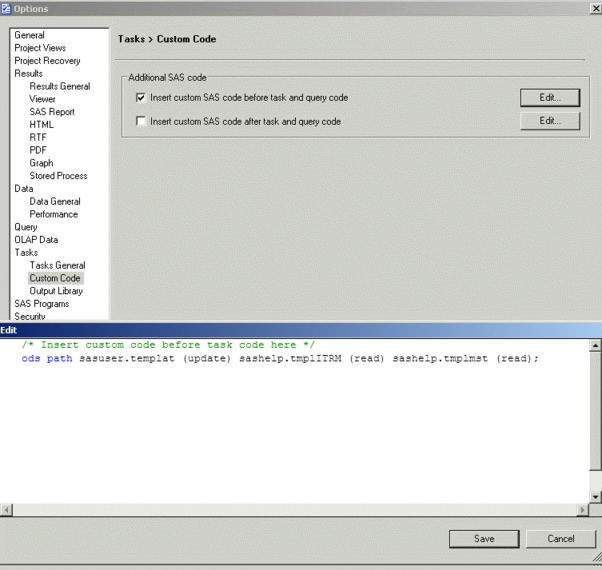
  4. Click the Edit button that is associated with the Insert custom SAS code box before task and query code check box.
    Custom Code Dialog Box
    Custom Code Dialog Box
  5. Verify that the following ODS path statement is present in the Edit window (as shown in the previous step):
    ods path sasuser.templat (update) sashelp.tmplITRM (read) 
             sashelp.tmplmst (read);
  6. If you do not see the ODS path statement, you might not have the correct SAS Enterprise Guide options file installed, or it might not be installed correctly.
    If this is the case, verify that the ITRM style sheet, ITRM banner, and EG Options components for your SAS Enterprise Guide are installed correctly. To do so, see Verifying the Presence of the ITRM Style Sheet, ITRM Banner, and EG Options Components in Your SAS Enterprise Guide Installation.
Verify that you are using the SAS IT Resource Management style sheet and banner.
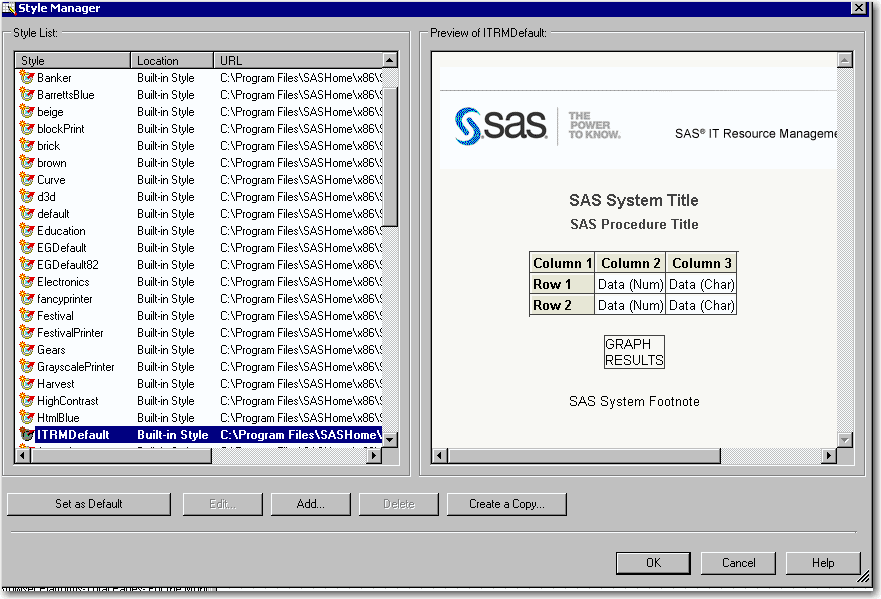
  1. From the menu bar of SAS Enterprise Guide, select Toolsthen selectStyle Manager. The following window appears:
    Style Manager Window of SAS Enterprise Guide
    Style Manager window of SAS Enterprise Guide
  2. In the Style Manager window, verify that the following conditions are satisfied:
    • In the Style List group box, ITRMDefault is selected as the default style sheet.
    • In the Preview pane, the ITRM banner is displayed.

Determining Why Java Applet Graphs Do Not Display Correctly

If your Java Applet graphs are not displaying correctly, the problem might be caused by an incorrect codebase, version of JRE, or graph format.
Verify that you are using the correct codebase.
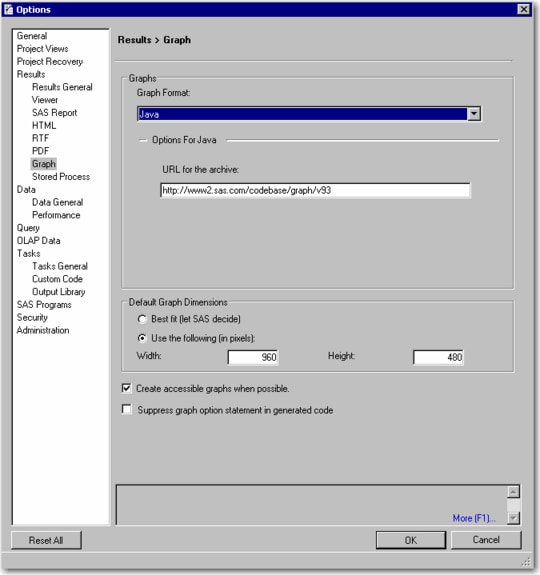
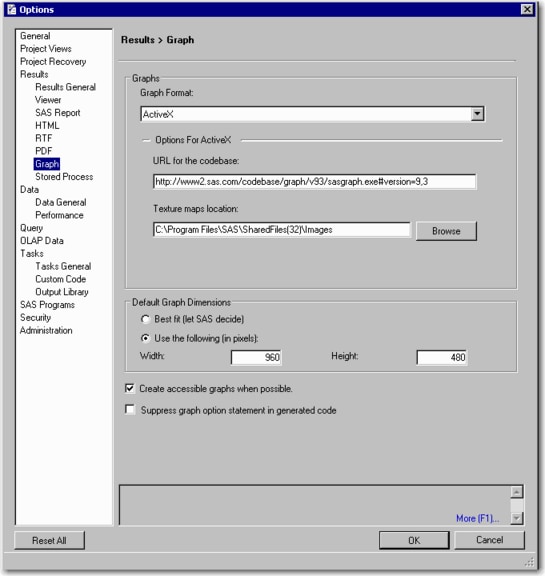
  1. From the menu bar of SAS Enterprise Guide, select Toolsthen selectOptions. Then click Graph.
  2. Set the Graph Format to Java and make sure that the URL for archive field is set to http://www2.sas.com/codebase/graph/v93.
    Results Window for Java Graphs
    Results Window for Java Graphs
  3. If you do not have access to the external Web or if you encounter performance issues using the default path, then change the URL to point to your local middle tier, such as http://Your_Middle_Tier:Port_Number/sasweb/graph.
  4. Make sure that the graph format is set back to your default format. Then click OK to save your settings.
Verify that the Java Console is enabled.
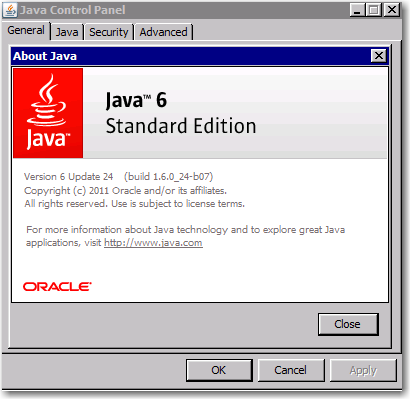
  1. Navigate to the Java Control Panel.
    Java Control Panel
    Java Control Panel
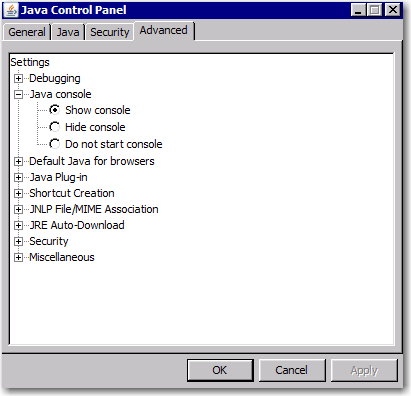
  2. Select the Advanced tab to display the following screen:
    Advanced Tab of the Java Control Panel
    Advanced Tab of the Java Control Panel
  3. Click Show console.
    Note: If you need more help locating this window, contact your system administrator.
  4. Click OK to close the Java Console Panel.
Generate the Java graph.
To generate a Java graph, perform the following steps:
  1. Perform one of the following actions:
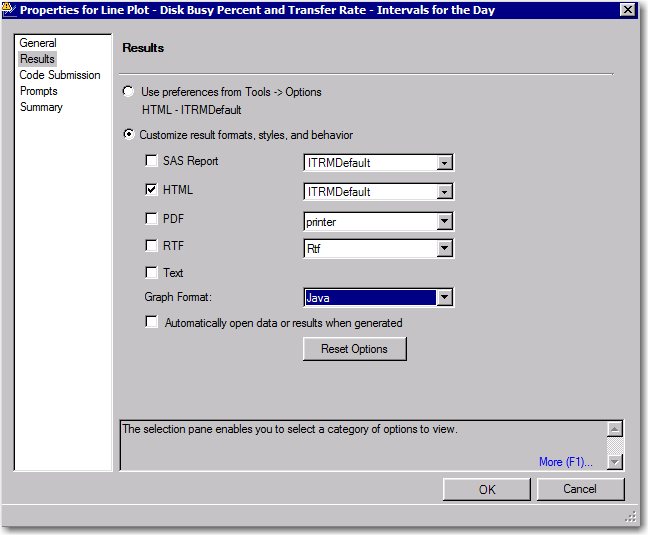
    • In the Results > Graph window of your EG Options file, set Graph Format to Java. Click OK to save Java as the default graph format. Then, in the report task Properties window, check Use preferences from Tools -> Options.
    • In the report task Properties window, check Customize result formats, styles, and behavior and set the Graph Format to ActiveX.
      Report Properties with Graph Format Set to Java
      Report Properties with Graph Format Set to Java
    Note: For best results, also check the HTML box and select the ITRMDefault style sheet.
  2. Generate your Java graph.
  3. If you are not able to view your Java graph, find the Java Console Panel. The panel displays the version of Java that you are using. Correct any errors or exceptions that are displayed.
    Determine whether you are using the version of the Java Runtime Environment (JRE) that SAS recommends for your version of SAS. See the SAS Third-Party Software Reference at http://support.sas.com/resources/thirdpartysupport/.

Determining Why ActiveX Graphs Do Not Display Correctly

If your ActiveX graphs are not displaying correctly, the problem might be caused by an incorrect codebase, version of ActiveX, or graph format.
Verify that you are using the correct codebase.
  1. From the menu bar of SAS Enterprise Guide, select Toolsthen selectOptions. Then click Graph.
  2. Set the Graph Format to ActiveX and make sure that the URL for the codebase field is set to this path: http://www2.sas.com/codebase/graph/sasgraph.exe#version=9,3.
    Results Pane for ActiveX Graphs
    Results Window for ActiveX Graphs
  3. If you do not have access to the external Web or if you encounter performance issues using the default path, then change the URL to point to your local middle tier. For example, your middle tier location might be: http://Your_Middle_Tier:Port_Number/sasweb/graph/sasgraph.exe#version=9,3.
  4. Make sure that the Graph Format is set back to your default. Then click OK to save your settings.
Generate the ActiveX graph.
To generate an ActiveX graph, perform the following steps:
  1. Perform one of the following actions:
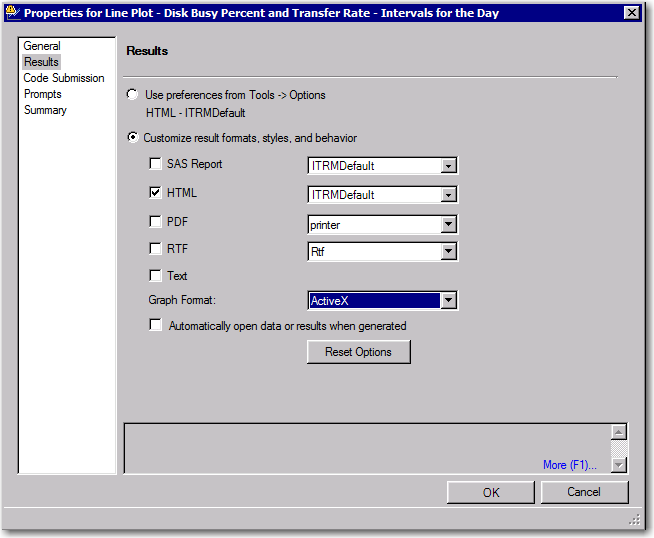
    • In the Results > Graph window of your EG Options file, set Graph Format to ActiveX, as shown in the preceding display. Then in the report task Properties window, check Use preferences from Tools -> Options. Click OK to save ActiveX as the default graph format.
    • In the report task Properties window, check Use preferences from Tools -> Options, as shown in the following display:
      Use Preferences from Tools - Options
      Use preferences from Tools - Options
      Note: For best results, also check the HTML box and select the ITRMDefault style sheet.
  2. Generate your ActiveX graph.
    Note: If ActiveX Control is not installed on your machine, you are prompted to install it. Accept the prompt.
    Additional information can be found here:
    • The ActiveX version that SAS recommends for your version of SAS is located here: http://sww.sas.com/dvr/graphs/Demos/Install.html.
    • http://sww.sas.com/helpdesk/documents/IE/.