Examples of the Exception Analysis Process
Example 1: Evaluating Server Usage with the Constant Threshold Expression Type
Problem Statement and Methodology
The capacity planner
of a large enterprise wants to determine whether the MIS Business
Intelligence servers (misbi4a, misbi5a, and misbi6a) in her company
are underused. These servers are dedicated to the MIS group. The
capacity planner wants to use facts to convince the MIS group to allow
these BI servers to be shared by other teams in the organization
that require access to the Business Intelligence software that is
hosted on these servers. The following example describes how this
is accomplished.
This example uses a
filter to specify MIS business intelligence servers. To avoid seeing
the same exceptions every day, the exception specification uses a
filter to look for exceptions for the last day only. The input source
is a DAYHOUR table called DayHourSystem. The exception definition
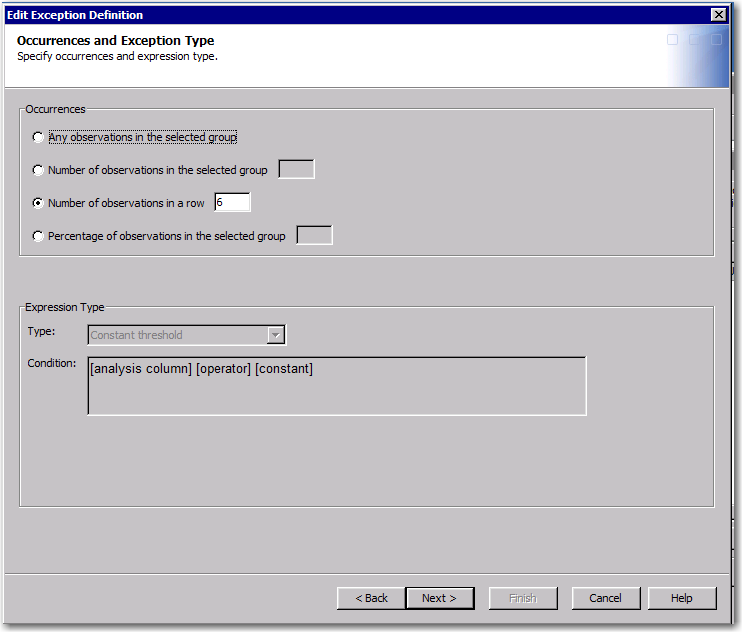
is set up to flag an exception if it discovers six consecutive hours
where the CpuBusyPctWMean is less than 20%. The group that is specified
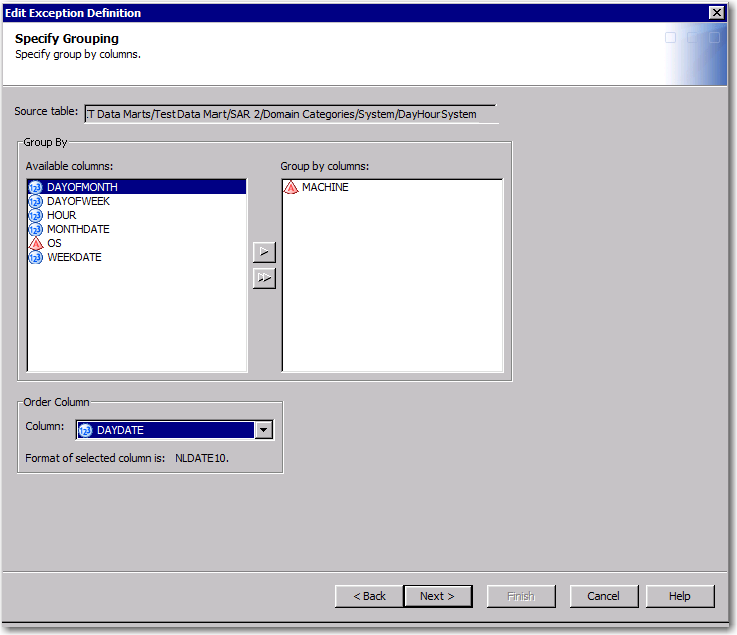
in the Exception transformation for this example is
MACHINE.
Setting Up the Exception Transformation
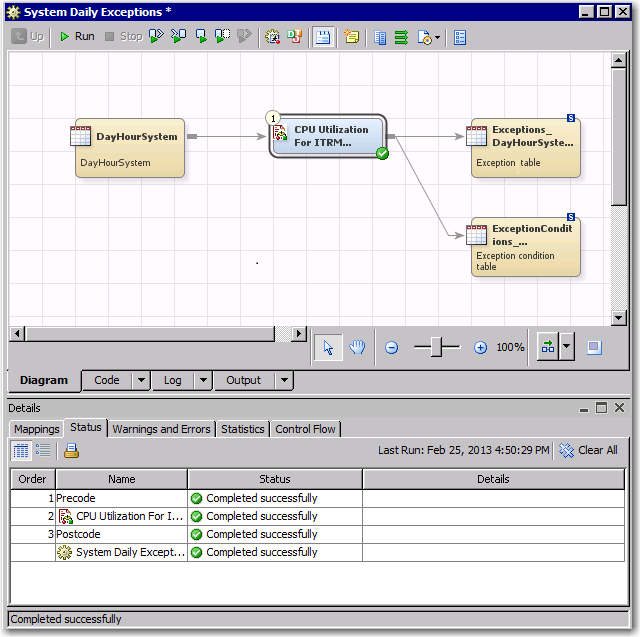
For this example, the
Exception transformation (CPU Utilization For MIS Business Intelligence
Servers) is executed from the job called System Daily Exceptions.
Both the exception table and the exception condition table are specified
for this transformation. Their contents can be used for additional
processing.
The name of the Exception
transformation is specified on the General tab.
In this example, the name is
CPU Utilization For ITRM
                        Servers
.
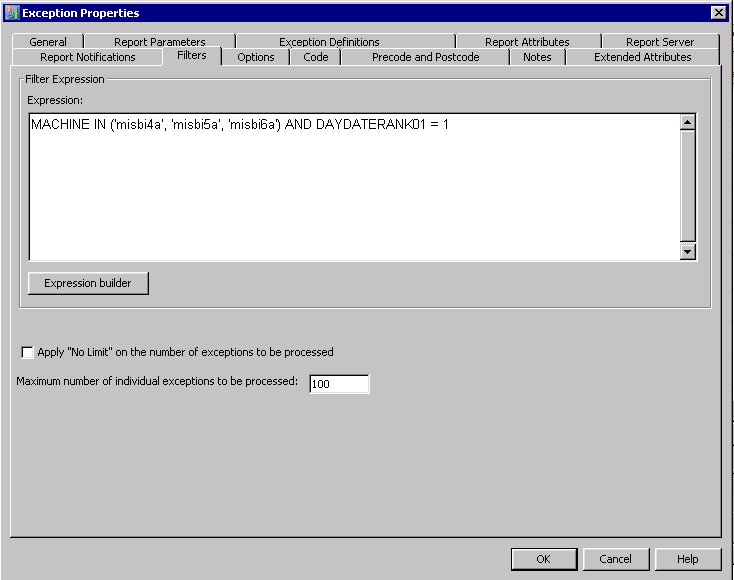
The Filters tab
causes the transformation to process only observations that pertain
to the date of the last date of data and the three machines (misbi4a,
misbi5a, and misbi6a).
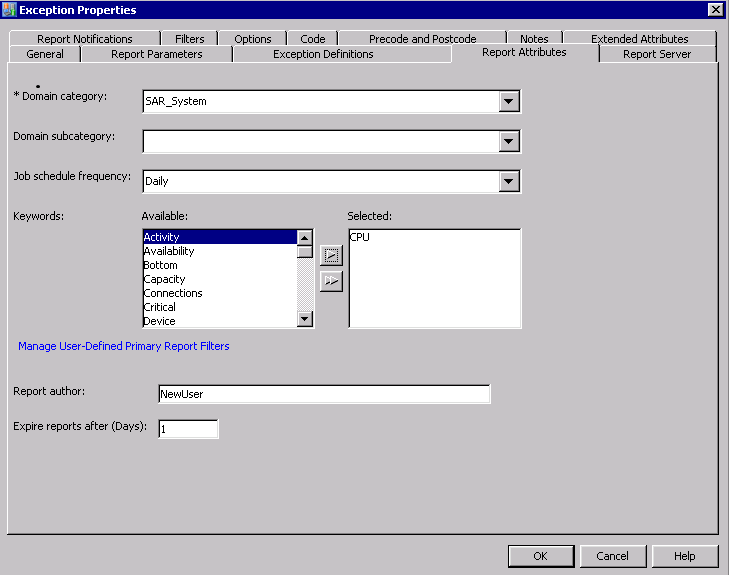
The filters that are
specified on the Report Attributes tab are
shown in the following display.
The Domain
subcategory is not specified.
Note: The exception definition
for this example is described in the following topic. This example
maintains the default values for the remaining tabs of the Exception
transformation.
Setting Up the Exception Definition
Running the Exception Job
When the job that contains
the Exception transformation is run and if an exception is detected,
two types of reports are generated:
-
an overview report.Note: An exception job with one or more exception definitions always generates an overview report. However, if no exceptions are found, no individual reports are generated.
-
an individual report for each Group By value that met the exception condition. The individual report shows the details that pertain to the exception that was flagged.
For this example, both
the exception table and the exception condition table are output from
the transformation.
Viewing the Exception Reports
The Exception transformation
creates an overview report. If exceptions are found, the transformation
also generates individual reports. The following display shows the
unexpanded overview report.

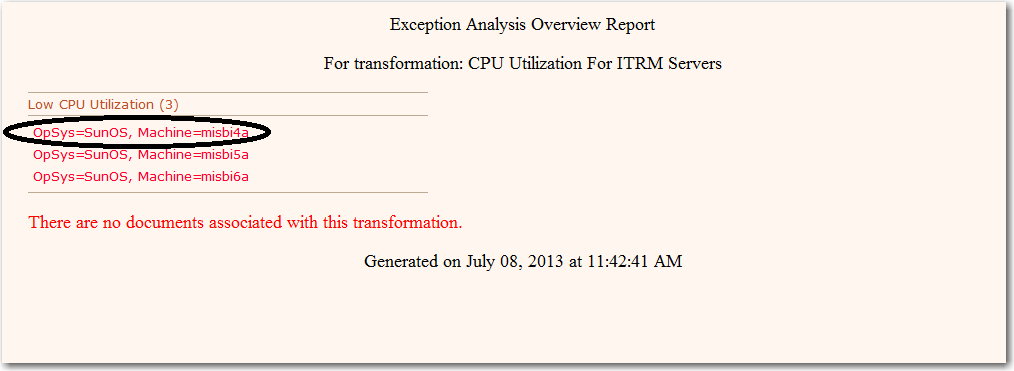
To see the expanded
version of the overview report, click the name of the exception definition.
(In the preceding display, this name is circled.) The expanded overview
report lists the Group By values (for the MACHINEs)
that matched the condition that was specified by the exception definition.
In this example, the following MACHINES had CPU Utilization below
20% for 6 observations (hours) in a row: misbi4a, misbi5a, and misbi6a.
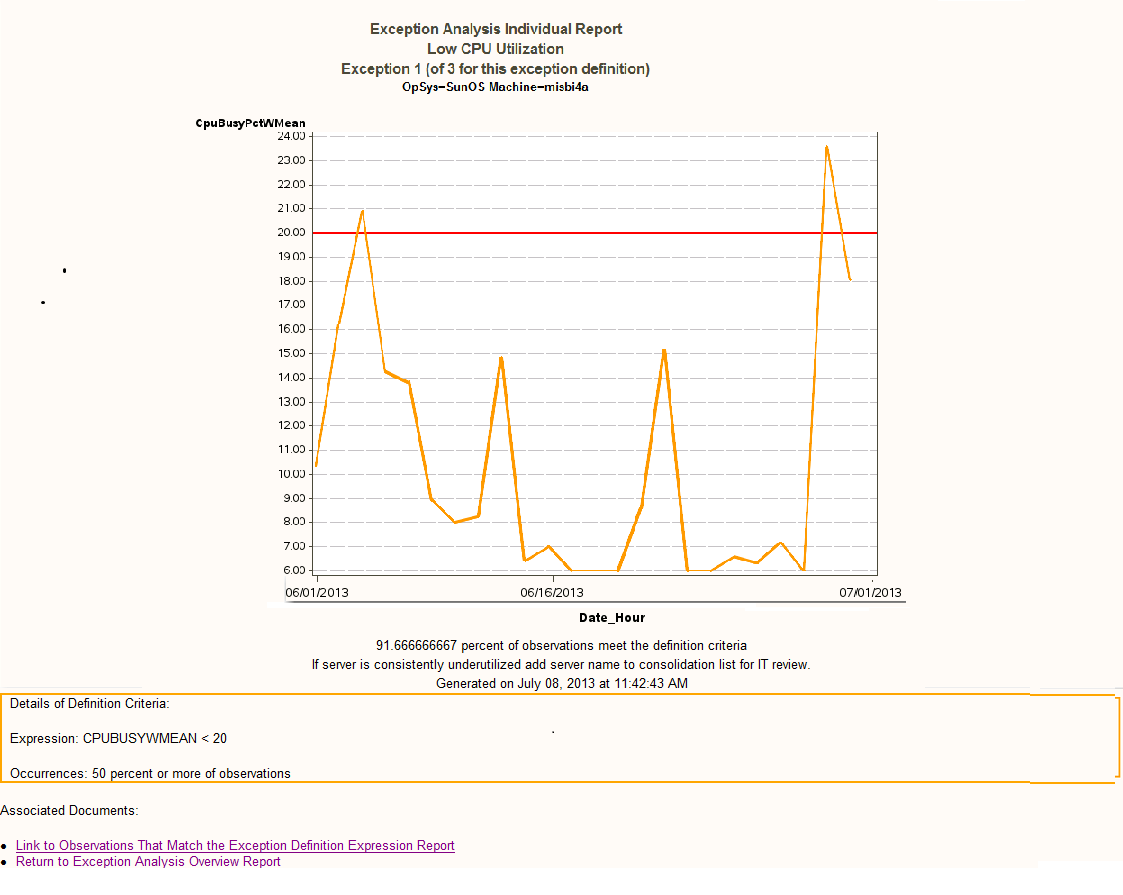
To see the individual
reports for the MACHINES that experienced low CPU utilization, click
the corresponding MACHINE. In the preceding
display, the misbi4a MACHINE is circled. That action displays the
individual report for misbi4a.
Note: The remainder of this example
pertains to the misbi4a machine.

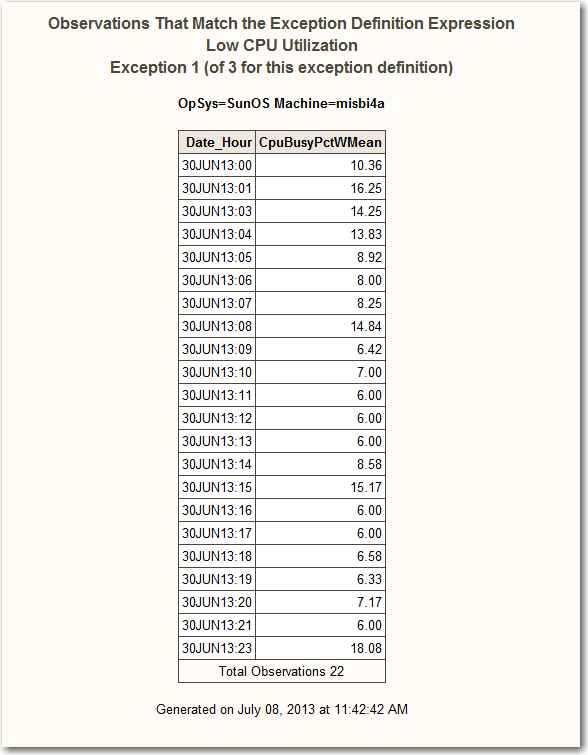
To see the observations
that matched the expression that was specified in the exception definition,
click Link to Observations That Match the Exception Definition
Expression Report. (The link is circled in the preceding
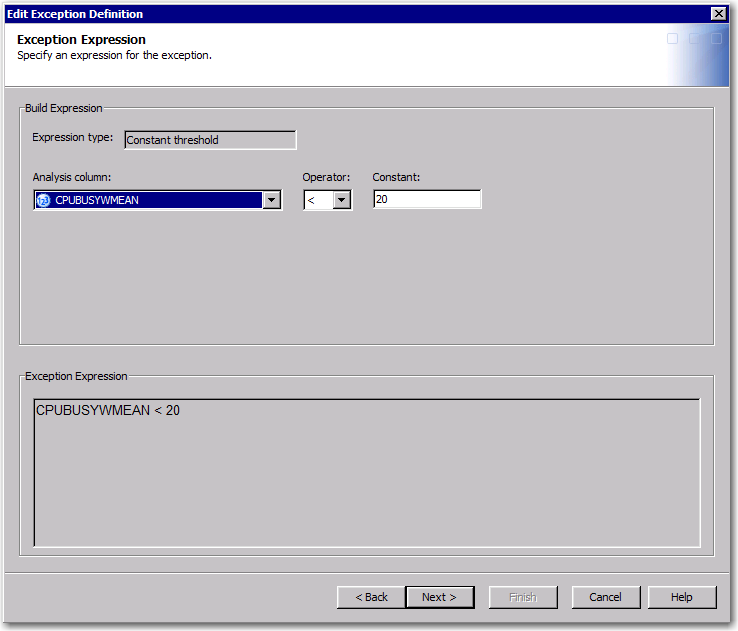
display.) The expression that was specified in the exception definition
is
CPUBUSYWMEAN < 20.
Analysis and Recommendations
As shown in the individual
report for misbi4a, the server is consistently underused. Except for
two significant periods of moderate usage, the server is not experiencing
much activity.
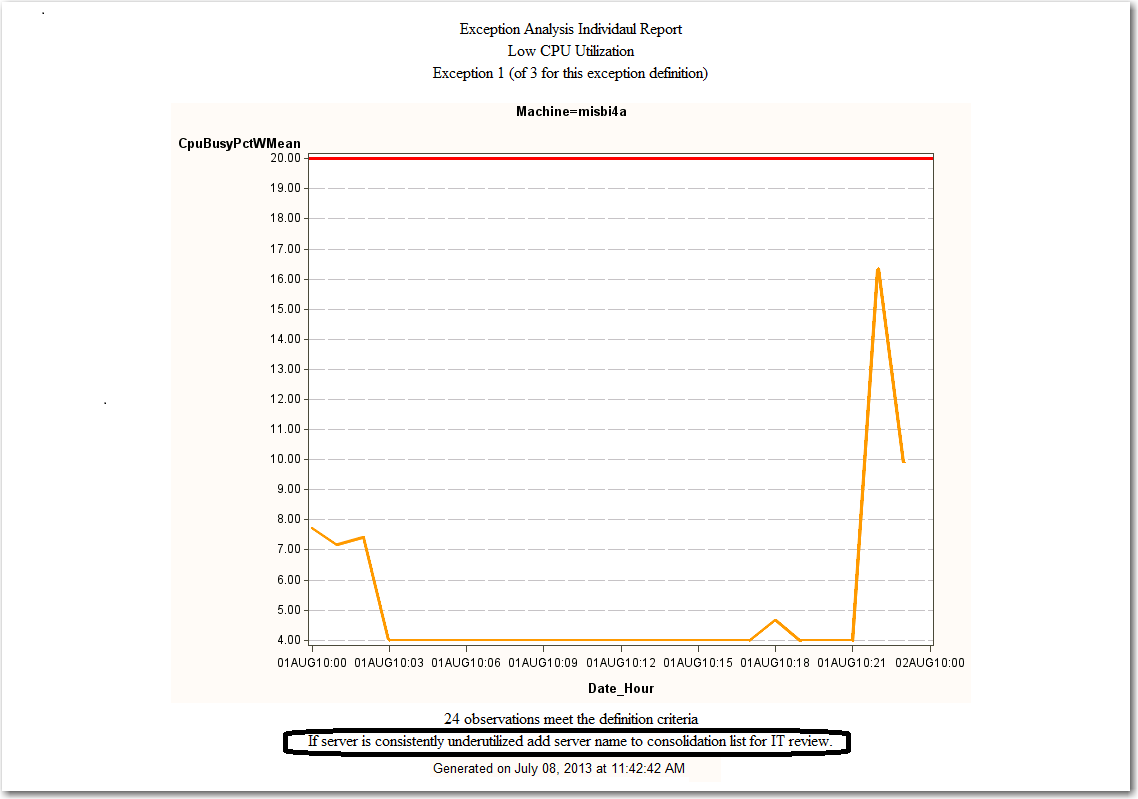
The recommendation that
is circled in this display suggests that this server be considered
for consolidation with another server.
Example 2: Detecting Sudden Increases in Demand with the Statistic Bounds Expression Type
Problem Statement and Methodology
The capacity planner
and the performance analyst would both like to be warned of sudden
spikes in resource consumption. Volatility of demand is a common
occurrence to some extent. However, sudden rises in resource demand
might also be due to changes in customer behavior or business needs
that were not anticipated. It might be necessary to make adjustments
on a short-term basis, and the capacity plan might need to be modified
as well.
Adding Moving Average Statistics to the Aggregation
In this example, the
performance analyst does not want to set a fixed threshold, because
a slow and steady growth in demand is expected. However, the analyst
still wants to be notified if the growth in demand is more sudden.
To accomplish this for CPU consumption, the analyst first defines
a moving average of the period and a moving standard deviation for
CPU time in the aggregation summary table. (These are based on the
weighted mean of
CPUBUSY.) These statistics
are used to construct a dynamic (rather than static) threshold for
warning of spikes in demand.
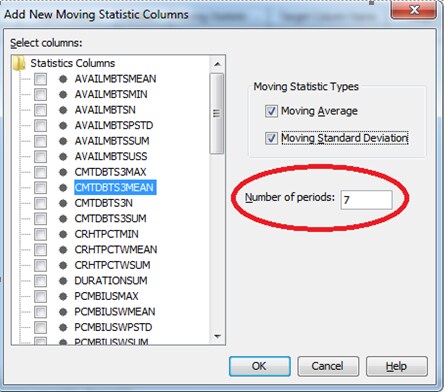
Note: For moving averages, the
period is specified when you define it on the New Moving
Statistics Column page of the Summarized
Aggregation Table wizard as shown in the following display.
Setting Up the Exception Transformation
In a new job with an
Exception transformation, using this aggregation summary table as
input, the analyst defines an exception definition that can detect
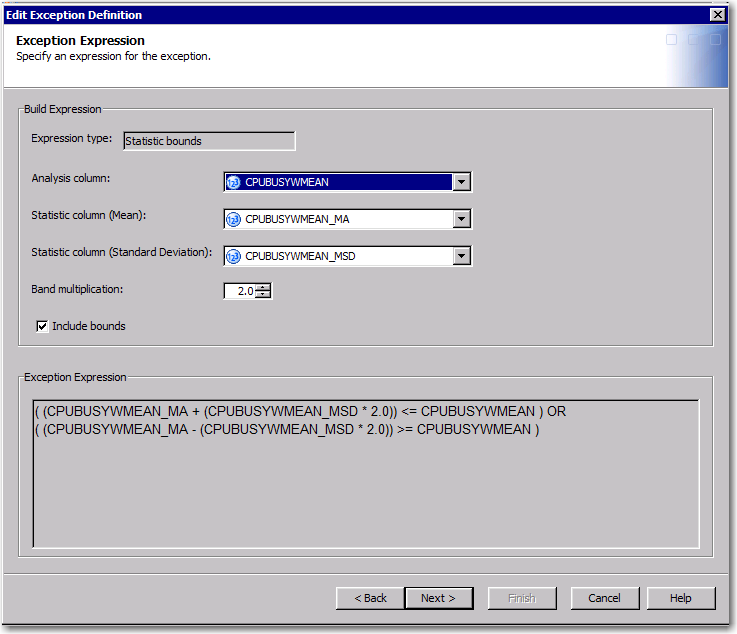
sudden spikes in CPU consumption. The exception definition uses statistic
bounds to compare the current CPU consumption as a weighted mean (
CPUBUSYWMEAN)
with a dynamic threshold consisting of the moving average of the same
underlying column (CPUBUSYWMEAN_MA)
plus or minus two standard deviations for the moving average (CPUBUSYWMEAN_MSD).
Running the Exception Job
If an exception is detected
when the job that contains the Exception transformation is run, two
types of reports are generated:
-
an overview report.Note: An exception job with one or more exception definitions always generates an overview report. However, if no exceptions are found, no individual reports are generated.
-
an individual report for each Group By value that met the exception condition. The individual report shows the details that pertain to the exception that was flagged.
For this example, both
the exception table and the exception condition table are output from
the transformation.
Analysis and Recommendations
The analyst tested the
new Exception transformation and definition by executing it against
existing data because she had already encountered recent episodes
of spikes in demand.
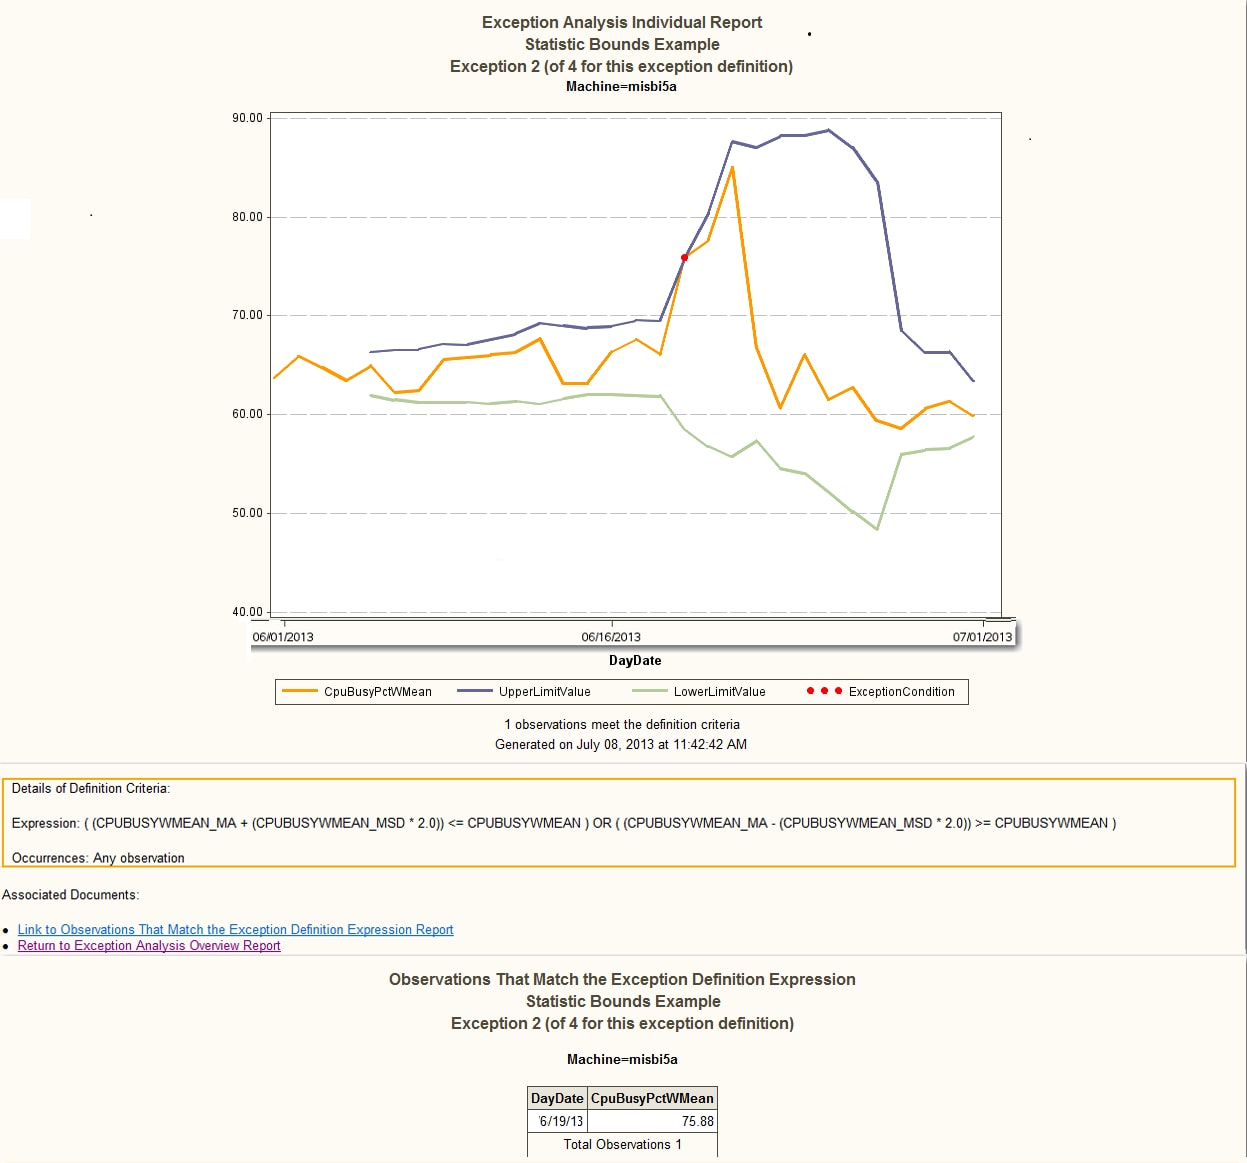
An exception was generated
for the misbi5a machine, among others, during the period for which
the analyst already had data. As illustrated by the plot, CPU consumption
exhibited slow but steady minor growth until the week of June 16.
The statistic bounds formed by the moving average and moving standard
deviation adjust for this growth automatically. However, during the
week of June 16, CPU consumption exploded upward and exceeded the
dynamic threshold. The exception was triggered by this sudden spike
in demand.
Note: As the spike in demand recedes,
the statistic bounds threshold automatically readjusts again as usage
returns to normal.
Satisfied that this
exception definition would provide her with alerts and accompanying
reports for the next spike in demand, the analyst put this job into
the normal daily schedule. The next time that this type of sudden
increase in demand occurs, the analyst will be notified on a daily
basis alerted of any future occurrence.
Copyright © SAS Institute Inc. All rights reserved.
